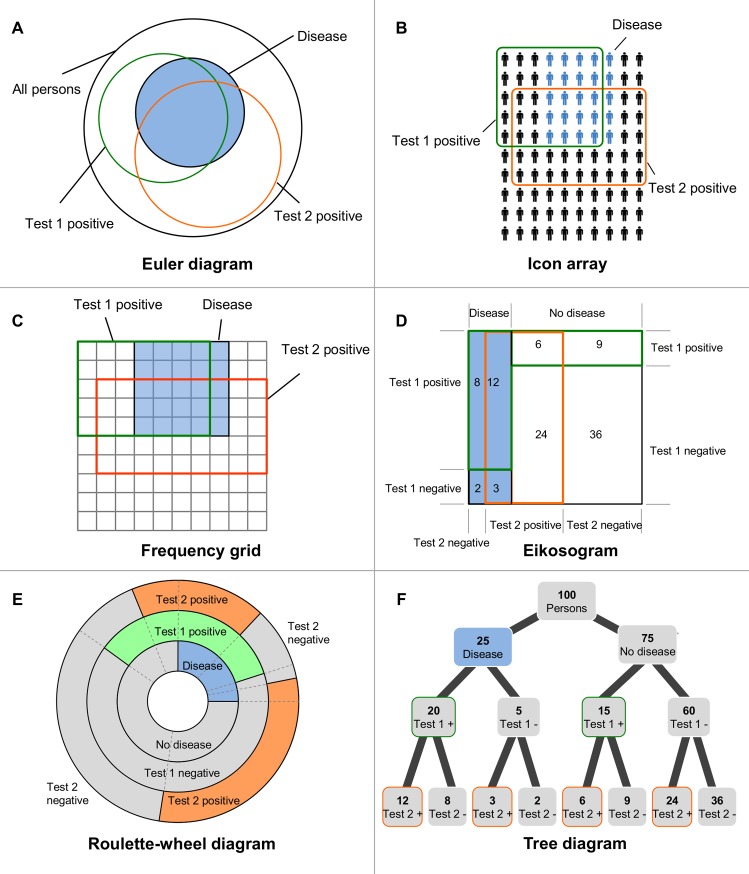
Fig 1. Six different types of visualization for the Bayesian 2-test case.
(A) Euler diagram (B) Icon array (C) Frequency grid (D) Eikosogram (E) Roulette-wheel diagram, and (F) Tree diagram. Omitting the information on the second test in the different visualizations results in the corresponding visualization of the 1-test case.

