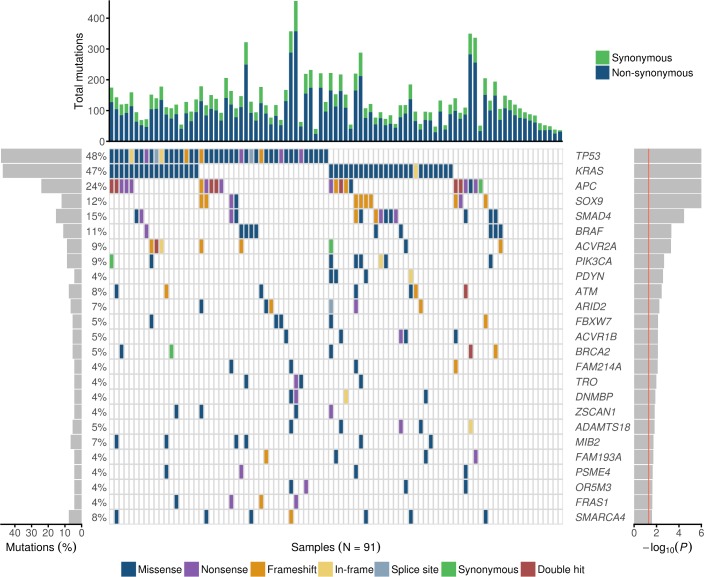
Fig 1. Mutational landscape of the most significant genes in MSS SBAs.
The figure includes the 25 highest-ranking genes in MSS tumors (n = 91) according to OncodriveFML, ranked by the P-value (right, red line at P = 0.05). Of these, TP53, KRAS, APC, SOX9, SMAD4, BRAF, and ACVR2A were significant also after correction for multiple testing. Different colors distinguish between the different types of mutations (in the middle). “Double hit” refers to two truncating mutations. The percentage of mutated tumors by gene are shown on the left. The upper bars represent the total number of both synonymous and non-synonymous mutations per tumor.

