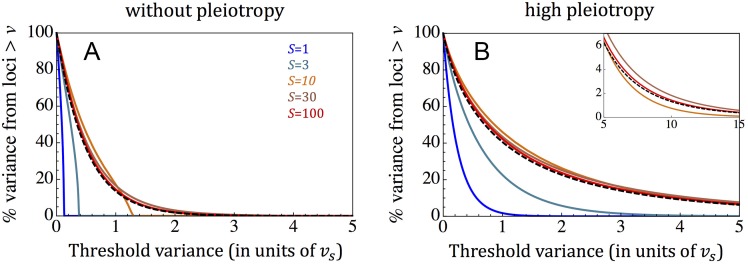
Fig 3. The proportion of additive genetic variance that arises from sites that contribute more than the value on the x-axis, for a single trait (A) and in the pleiotropic limit (B).
Our approximations for sites under strong selection (Eqs 12 and 14) are shown with the dashed black curves. For the approximations in the effectively neutral limit (Eqs 14 and 16), see Fig A4 in S1 Text.

