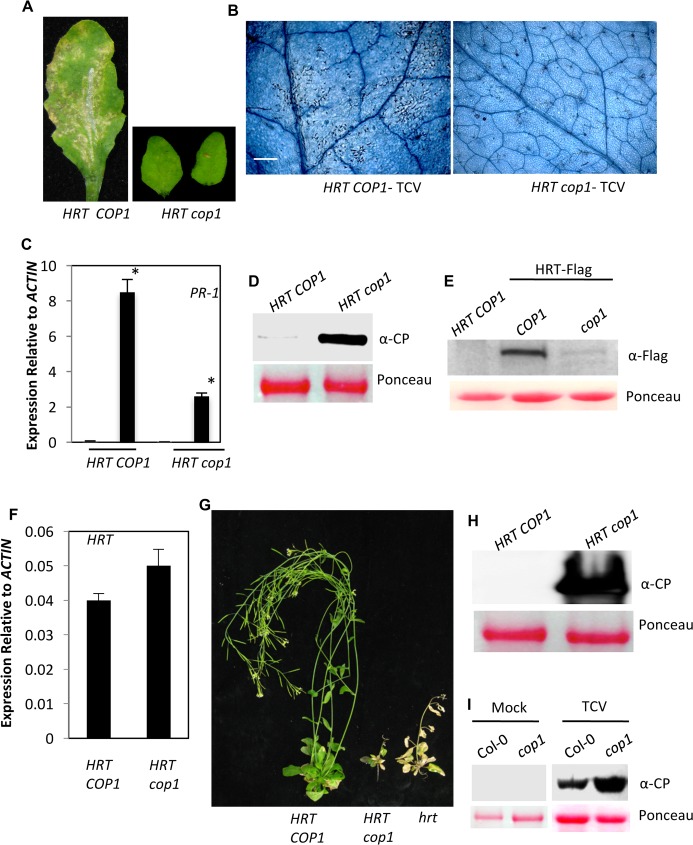
Fig 1. COP1 is a positive regulator of HRT-mediated defense against TCV.
(A) HR formation in TCV-inoculated HRT COP1 and HRT cop1 genotypes at 3 dpi. The HR phenotype was evaluated in ~30 plants that were analyzed in three separate experiments. (B) Trypan blue stained leaves showing microscopic cell death phenotype at 3 dpi with TCV. Scale bars, 270 microns. At least six independent leaves were analyzed with similar results. (C) Real-time quantitative RT-PCR analysis showing relative expression levels of PR-1 in mock- and pathogen-inoculated plants. Leaves were sampled 24 h post treatments. The error bars indicate SD (n = 3). Asterisk denotes significant differences from mock-treated leaves (t test, P<0.003). Results are representative of two independent experiments. (D) Western blot showing relative CP levels in indicated genotypes inoculated with TCV. Leaves were sampled at 3 dpi. Ponceau-S staining of Rubisco was used as the loading control. This experiment was repeated two times with similar results. (E) Western blots showing relative levels of HRT-Flag in indicated genotypes expressing HRT-Flag transgene. Ponceau-S staining of the Western blots was used as the loading control. This experiment was repeated three times with similar results. (F) Real-time quantitative RT-PCR analysis showing relative expression levels of HRT in indicated genotypes. The error bars indicate SD (n = 3). Results are representative of two independent experiments. (G) Typical morphological phenotypes of TCV inoculated HRT COP1 (Di-17 ecotype), HRT cop1 and hrt (Col-0 ecotype) plants. Plants were photographed at 18 dpi. (H) Western blot showing relative CP levels in distal bolt tissues of indicated genotypes. Plants were inoculated with TCV and the distal uninoculated tissues were sampled at 3 dpi. Ponceau-S staining of the western blot was used as the loading control. This experiment was repeated two times with similar results. (I) Western blot showing relative CP levels in mock- and TCV-inoculated genotypes. Plants were inoculated with buffer or TCV and the inoculated tissues were sampled at 3 dpi. Ponceau-S staining of the western blot was used as the loading control. This experiment was repeated two times with similar results.

