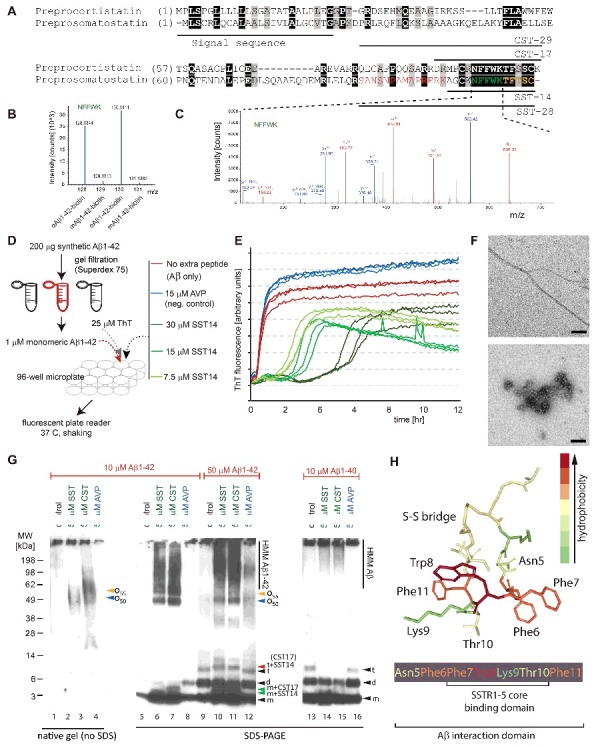
Figure 1.

Discovery and validation of SST-Aβ interaction. (A) Sequence alignment of preprocortistatin and preprosomatostatin. The signal sequence and the boundaries of the bioactive cortistatin and somatostatin peptides are indicated by horizontal bars. Identical residues are highlighted by black background shading, and peptide sequences observed by mass spectrometry are shown in colored fonts. (B) Expanded view of MS3 spectrum derived from ‘NFFWK’ parent spectrum (shown to the right) in interactome study based on oAβ1–42-biotin baits and mAβ1–42-biotin negative controls. In this view, the relative intensities of tandem mass tag signature ions reflect the relative abundances of the ‘NFFWK’ peptide in side-by-side generated affinity purification eluate fractions, indicating preferential binding of SST to pre-aggregated oAβ1–42. (C) Example tandem MS spectrum supporting the identification of the peptide with amino acid sequence ‘NFFWK’. Fragment masses attributed to B- and Y- ion series are shown in red and blue colors, respectively. (D) Workflow of ThT-based aggregation assay. (E) SST14 delays Aβ1–42 aggregation in ThT fluorescence assay in a SST14 concentration dependent manner. (F) Negative stain electron microscopy of Aβ1–42 and Aβ1–42–SST14 complexes. Top panel: Aβ1–42 was fibrillized in PBS at a concentration of 50 μM. Individual Aβ1–42 amyloid fibrils and small clusters were visualized. Bottom panel: Incubation of equimolar concentrations (50 μM) of Aβ1–42 and SST14 under identical conditions resulted in oligomeric assemblies only. No amyloid fibrils were observed. Magnification bars = 100 nm. (G) Immunoblot analyses with an antibody directed against an N-terminal Aβ epitope (6E10) reveal that CST17 (or SST14) co-assemble with Aβ1–42 into oligomers of 50–60 kDa that withstand boiling (lanes 2 and 3) but partially disintegrate in the presence of SDS. Note bands of 5–6 kDa, consistent with the existence of SDS-resistant heterodimeric complexes of mAβ1–42 and SST14 (or CST17), and the well-defined oligomeric bands of 50 and 55 kDa (lanes 6 and 7) that were observed in samples derived from the co-incubation of SST14 (or CST17) with Aβ1–42, but not Aβ1–40 (lanes 6, 7, 14, 15). Note also that signals interpreted to represent trimeric Aβ1–42, but not dimeric Aβ1–42, can be seen to migrate slower in the presence of SST14 (or CST17) but not in the presence of the negative control peptide AVP (compare lanes 9 and 12 with lanes 10 and 11). Finally, intensity levels of homodimeric Aβ1–42 bands are reduced in the presence of SST14 (or CST17) (compare lanes 13 and 16 with lanes 14 and 15). Black arrowhead labeled with ‘m’, ‘d’, and ‘t’ designate bands interpreted to consist of monomeric, dimeric and trimeric Aβ1–42. Green and red arrowheads were used to label bands interpreted to represent SDS-stable heteromeric building blocks consisting of SST14 (or CST17) bound to monomeric and trimeric Aβ1–42, respectively. (H) Model of SST14, showing the position of its disulfide bridge between cysteine 3 and 14, and the binding domains required for docking to its SST receptors or Aβ. Elements from this image were adapted from,[8] licensed under CC BY 4.0.
