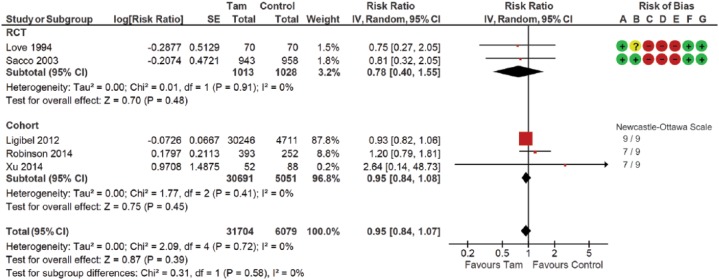
Figure 2.
Forest plot of comparison for fracture risk between women treated with tamoxifen and not treated with tamoxifen (control) by study design subgroups.
The large diamond at the bottle of the table represents the pooled risk ratio of all studies. The width of the diamond represents with 95% CI. Results of study quality assessment were included.
Risk of bias: (A) random sequence generation (selection bias); (B) allocation concealment (selection bias); (C) blinding of participants and personnel (performance bias); (D) blinding of outcome asessment (detection bias); (E) incomplete outcome data (attrition bias); (F) selective reporting (reporting bias); (G) other bias.
 Low risk of bias
  Unknown risk of bias
  High risk of bias
CI, confidence interval; d.f., degrees of freedom; IV, inverse variance; RCT, randomized controlled trial; SE, standard error; Tam, tamoxifen.

