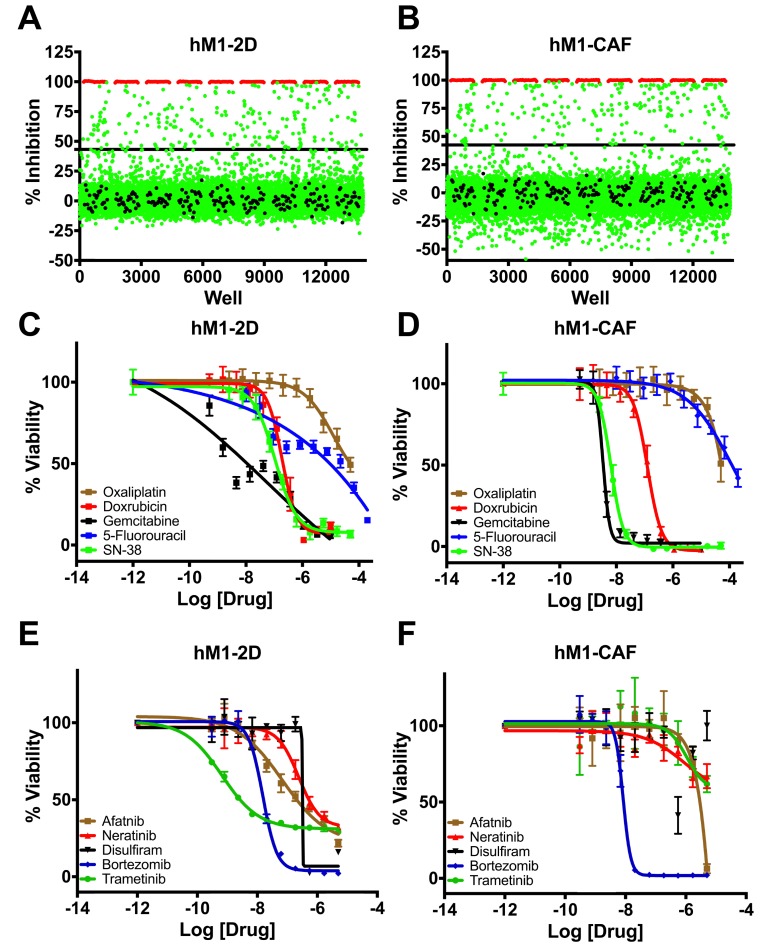
Figure 13. High throughput therapeutic screen of hM1 cells identifies high efficacy targeted inhibitors.
Growth inhibition effect in hM1 cancer cell line A. and in cancer associated fibroblasts B. in response to 3200 approved agents. Dose response curves for cytotoxic chemotherapeutics C. and D. and selected targeted inhibitors in therapeutic screen E. and F.

