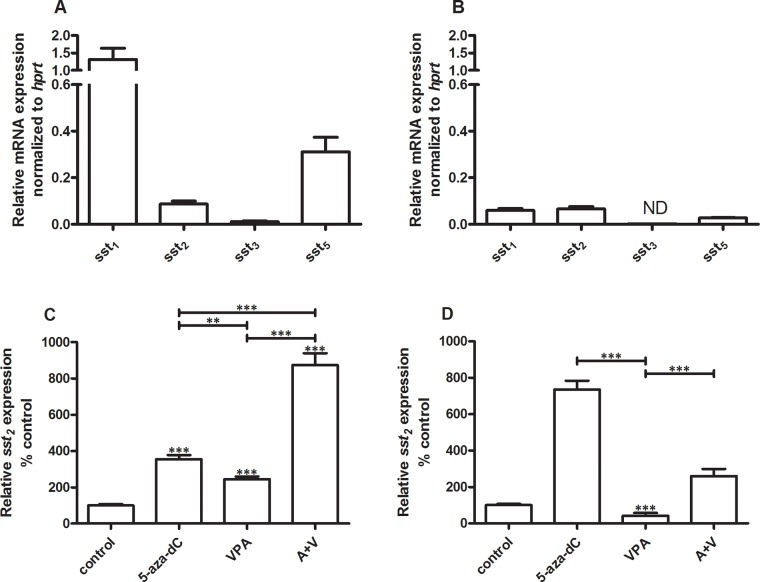
Figure 1. Ssts mRNA expression levels.
Mean expression levels ± SEM of ssts in BON-1 cells (n=2) A and QGP-1 cells (n=3) B, C. effect of treatment with 5-aza-dC (100 nM), VPA (2.5 mM) or the combination of both drugs on sst2 expression in BON-1 cells, D. effect of treatment with 5-aza-dC (50 nM), VPA (1 mM) or the combination of both drugs on sst2 expression in QGP-1 cells. Data are the mean ± SEM and expressed as the percentage of untreated control cells. The expression levels were normalized to housekeeping gene hprt. **p<0.01, ***p<0.001, ND: not detectable.

