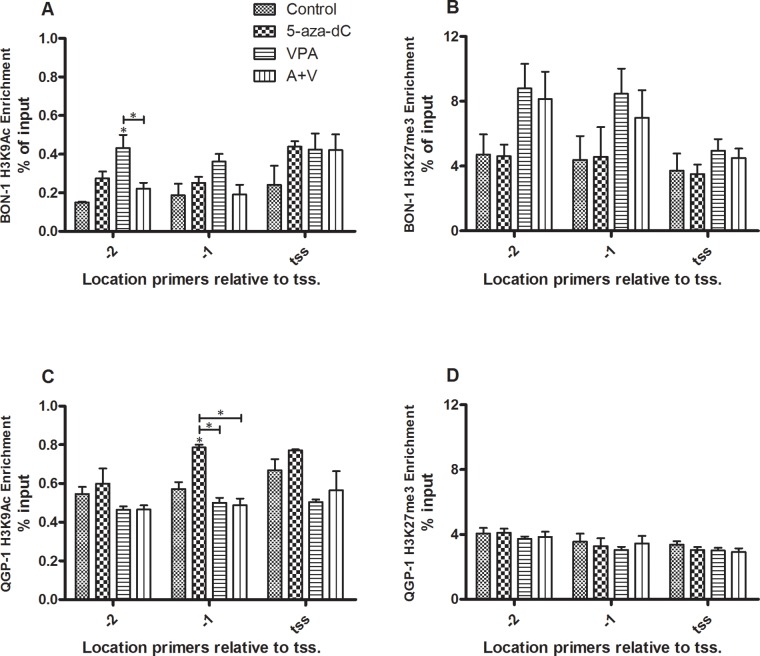
Figure 5. ChIP of histone marks H3K9Ac and H3K27me3 for the sst2 promoter.
Enrichment of the sst2 promoter as determined by ChIP for histone marks H3K9Ac and H3K27me3 (mean ± SEM) in BON-1 and QGP-1 cells, without or with treatment with 5-aza-dC (BON-1: 100 nM, QGP-1 50 nM), VPA (BON-1: 2.5 mM, QGP-1: 1 mM), or their combination. A. H3K9Ac in BON-1 cells (n=2) B. H3K27me3 in BON-1 cells (n=3) C. H3K9Ac in QGP-1 cells (n=2) D. H3K27me3 in QGP-1 cells (n=3). *p<0.05 vs untreated control.

