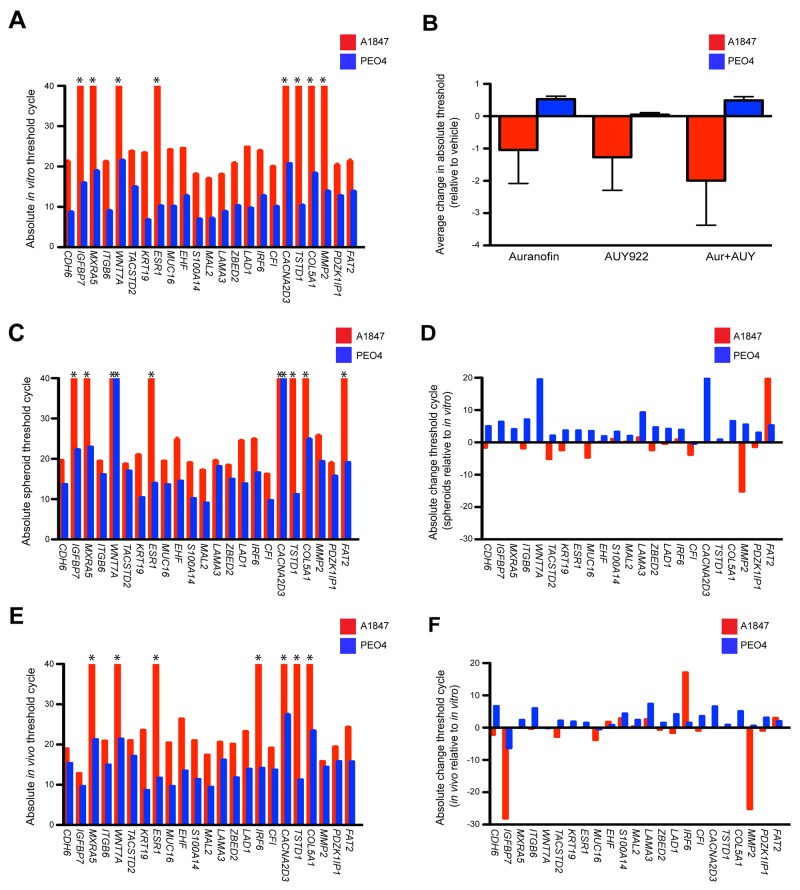
Figure 4. Expression of a 23-gene resistant signature using both in vitro and in vivo models.
(A) The 23-gene resistant profiles of A1847 and PEO4 cultured cells were evaluated utilizing TaqMan assays on the Biomark high-density qPCR system. Absolute cycle threshold values ± standard error of the mean from triplicate reactions of two independent experiments are graphed. Asterisks designate lack of amplification curves within 40 cycles. (B) Average variation of cycle thresholds for A1847 and PEO4 cultured cells treated with the indicated compounds, both alone and in combination (Aur + AUY). Data are displayed as bar graphs representing the difference of absolute threshold cycle ± standard error of the mean as compared to basal transcription from triplicate reactions of two independent experiments. Positive and negative columns signify higher and lower Ct values, respectively. (C, E) The 23-gene resistant profile was evaluated in A1847 and PEO4 spheroids and in vivo xenografts utilizing TaqMan assays on the Biomark high-density qPCR system. Absolute cycle threshold values ± standard error of the mean from triplicate reactions of two independent experiments are graphed. Asterisks designate lack of amplification curves within 40 cycles. (D, F) Absolute variation of cycle threshold for A1847 and PEO4 spheroids and in vivo xenografts compared to cultured cells. Data are displayed as bar graphs representing the difference between absolute threshold cycles using triplicate reactions of two independent experiments. Positive and negative columns signify higher and lower Ct values, respectively.

