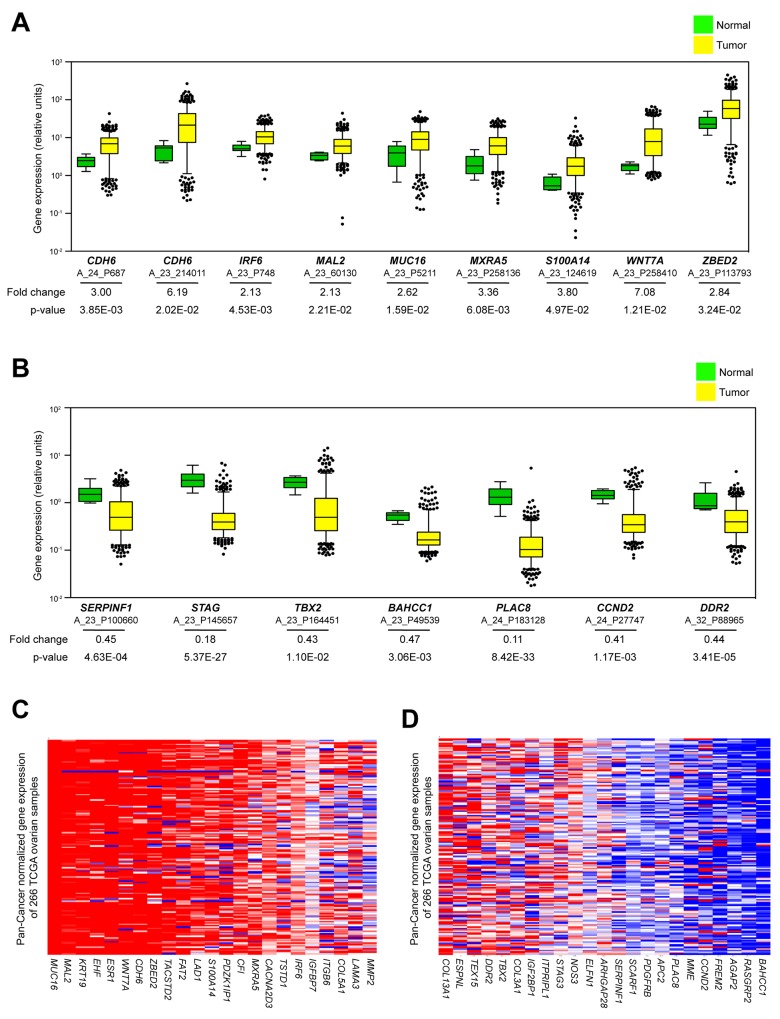
Figure 5. Investigation of publicly available datasets for prevalence of genetic signatures.
(A) Average expression values of Agilent probes related to an increase in the resistant signature from 518 TCGA tumors relative to 8 fallopian control samples. Data are displayed as box plots representing 8 genes (derived from 9 unique probes) that showed average increase of expression in tumors (yellow) greater than 2-fold increase over fallopian (green). (B) Average expression values of Agilent probes related to a decrease in the sensitive signature from 518 TCGA tumors relative to 8 fallopian control samples. Data are displayed as box plots representing 7 genes (derived from 7 unique probes) that showed average decrease of expression in tumors (yellow) greater than 2-fold increase over fallopian (green). The whiskers of each box plot represent expression values at 5th and 95th percentiles. Average fold change expression and p-values are indicated for each probe. (C, D) Heat map data of mRNA expression related to resistant and sensitive signatures from 266 TCGA serous ovarian patient samples sequenced using Illumina technology. All samples are mean-normalized per gene to 19 tumor types using Pan-Cancer analysis. Red and blue indicate increased and decreased mRNA expression, respectively.

