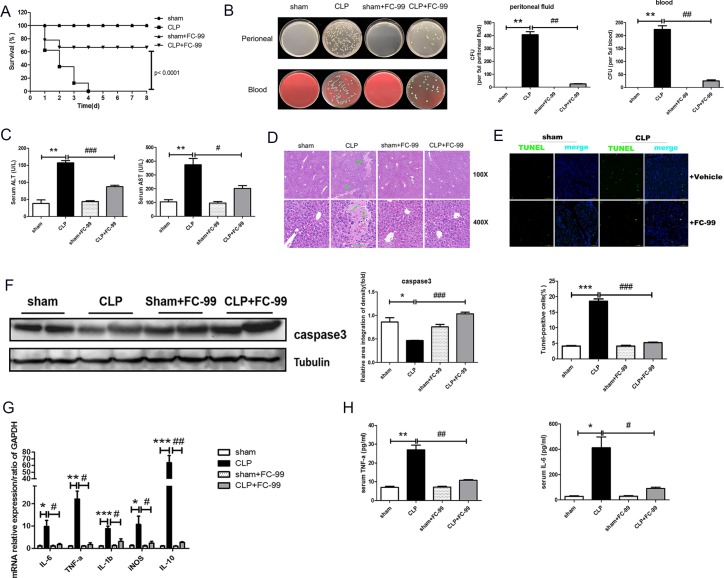
Figure 1. Effects of FC-99 on CLP-induced pathological changes in the liver tissue of mice.
All mice were pretreated with FC-99 (10 mg/kg, i.p.) 2 h prior to sham operation (sham+FC-99) and/or prior to CLP operation (CLP+FC-99), and/or prior to direct operation (sham, CLP). (A) The survival rate was monitored once every 24 h for 8 days, n = 8 miceper group). (B) The bacterial burden was determined by counting the number of CFUs on blood agar plates and/or LB nutrient agar plates following serial dilution of blood and peritoneal lavage samples. Blood and lavage fluid were collected at 24 h following CLP. (C) Serum concentrations of ALT and AST were assessed 24 h post-surgery. (D) H&E staining of liver tissues from each group at 24 h, as determined by a two-dimensional graph. Scale bar, 200 and/or 50 μm (magnification: upper: 100x, lower: 400x); (E) Hepatocyte apoptosis was detected by TUNEL assay, which displayed green immunofluorescence at 24 h (magnification 200x). Scale bar, 100 μm. Vehicle represents the non-treatment group. The histogram indicates the ratio of TUNEL-positive cells at 24 h. The data are presented as mean ± SD (n = 3); (F) Western blot analysis indicated the protein expression of caspase3 in the liver tissues; G. The mRNA expression levels of the macrophage-associated inflammatory cytokines, IL-6, TNF-α, IL-1β, iNOS, and IL-10, in the liver of CLP mice were detected by qRT-PCR. The samples were collected at 24 h post-surgery. H. The levels of IL-6 and TNF-α in the serum were determined by ELISA at 24 h. The data are presented as mean ± SEM of at least three independent experiments. *P < 0.05, **P < 0.01, ***P < 0.005, vs. sham operation group; #P < 0.05, ##P < 0.01, ###P < 0.005, vs. CLP group; ns: no significant difference.

