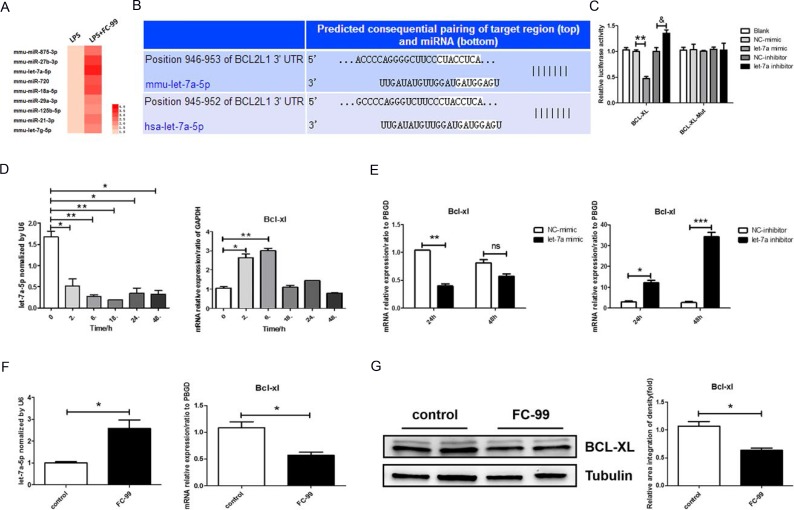
Figure 5. Let-7a-5p was increased during FC-99-induced macrophage apoptosis.
(A) The differences in the miRNA profile of FC-99 under LPS-simulated inflammatory stimuli were analyzed using a microarray and presented as a heatmap in which, red indicated induction of miRNA expression. (B) Schematic illustration of the potential let-7a-5p binding sites on the 3’-untranslated regions (3’-UTRs) of BCL2L1 (BCL-XL). (C) The activity of wild type and/or mutant BCL-XL-3’UTR in THP-1 cells co-transfected with control, let-7a-5p mimic, and/or let-7a-5p inhibitor as determined by luciferase reporter assays. Relative Double-luciferase activity was normalized to the scrambled oligonucleotide control. (D qRT-PCR assessment of the expression levels of let-7a-5p and its target gene, BCL-XL, in the mouse monocyte/macrophage cell line RAW264.7 at 0, 2, 6, 18, 24, and 48 h time points, respectively. (E) qRT-PCR evaluation of the expression of BCL-XL (the target gene of let-7a) in response to transfection with let-7a-5p mimic/inhibitor (50 nM final concentration) in THP-1 cells for 24 and/or 48 h. *P < 0.05, **P < 0.01, ***P < 0.005, vs. negative control or untreated group in vitro. F and G. THP-1 cells were divided into two groups: untreated group that comprised control cells treated with PMA (2.5 ng/mL) for 48 h and FC-99-treated group that comprised FC-99 (10 μM) treatment 2 h prior to 48 h PMA (2.5 ng/mL) treatment. qRT-PCR was employed to detect the expression of let-7a-5p and the mRNA levels of its target gene, BCL-XL (F). Western blot analysis with regard to the expression levels of the anti-apoptotic protein, BCL-XL (G). The results were represented as means ± SEM from four independent experiments. *P < 0.05, vs. control group; **P < 0.005, vs. NC-mimic group; &P < 0.05, vs. NC-inhibitor group.

