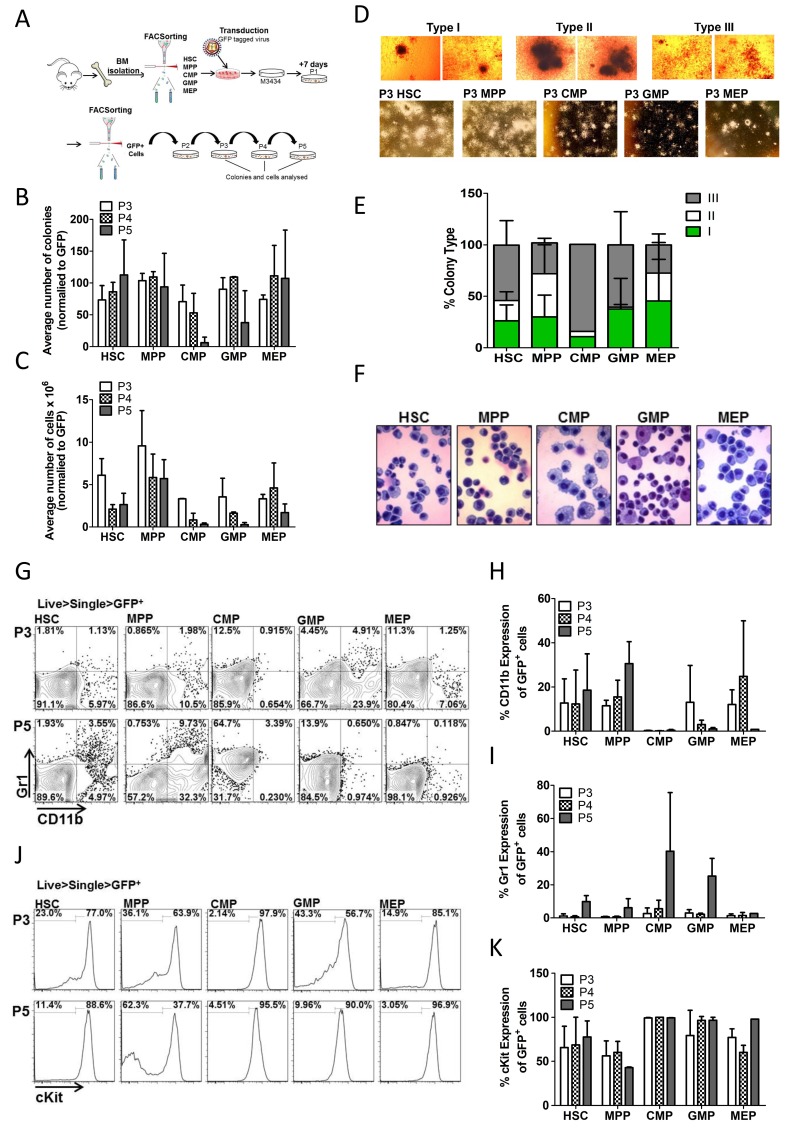
Figure 1. Trib2 transforms all HSPC populations with varying efficiency and immunophenotypes.
(A) Schematic overview of CFC experiments. Murine BM cells were isolated and sorted for HSC, MPP, CMP, GMP and MEP populations. Following transduction the Trib2 expressing cells were plated in M3434 methylcellulose media 24hrs later. After 7 days (P1) colonies had formed, cells were sorted for GFP expression and GFP+ cells were serially replated to P5. Colonies and cells were analysed at P3, P4 and P5. (B) Average number of colonies at each replating normalised to GFP expression. Averages are of 2 independent experiments each with 3 technical replicates shown +/− SD. (C) Average number of cells produced at each replating. Averages are of pooled triplicate plates from 2 independent experiments +/− SD. (D) Representative images of colony types at P3 under 4x magnification (top) and 2x magnification (bottom). (E) Distribution of colony types at P5. Bars represent the average of 2 independent experiments each with 3 technical replicates +/− SD. (F) Cellular morphology of Trib2 transformed stem and progenitor cells. Cells from P3 colonies were spun onto glass slides using a cytocentrifuge and stained with the KwikDiff staining system. Representative images are shown, taken under 40X magnification. (G) Cells from each replating were stained for CD11b and Gr1 and analysed by flow cytometry. Representative flow cytometric analysis of GFP+ Trib2transformed stem and progenitor cells from P3 and P5. Graphs represent the average percentage expression of CD11b (H) and Gr1 (I) of GFP+ Trib2transformed stem and progenitor cells from P3, P4 and P5. Data represent the average of 2 independent experiments +/− SD. (J) Representative flow cytometric analysis of GFP+ Trib2 transformed stem and progenitor cells from P3 and P5 for cKit expression. (K) Graphs represent the average percentage expression of cKit on GFP+ Trib2 transformed stem and progenitor cells from P3, P4 and P5. Data represents the average of 2 independent experiments +/− SD.

