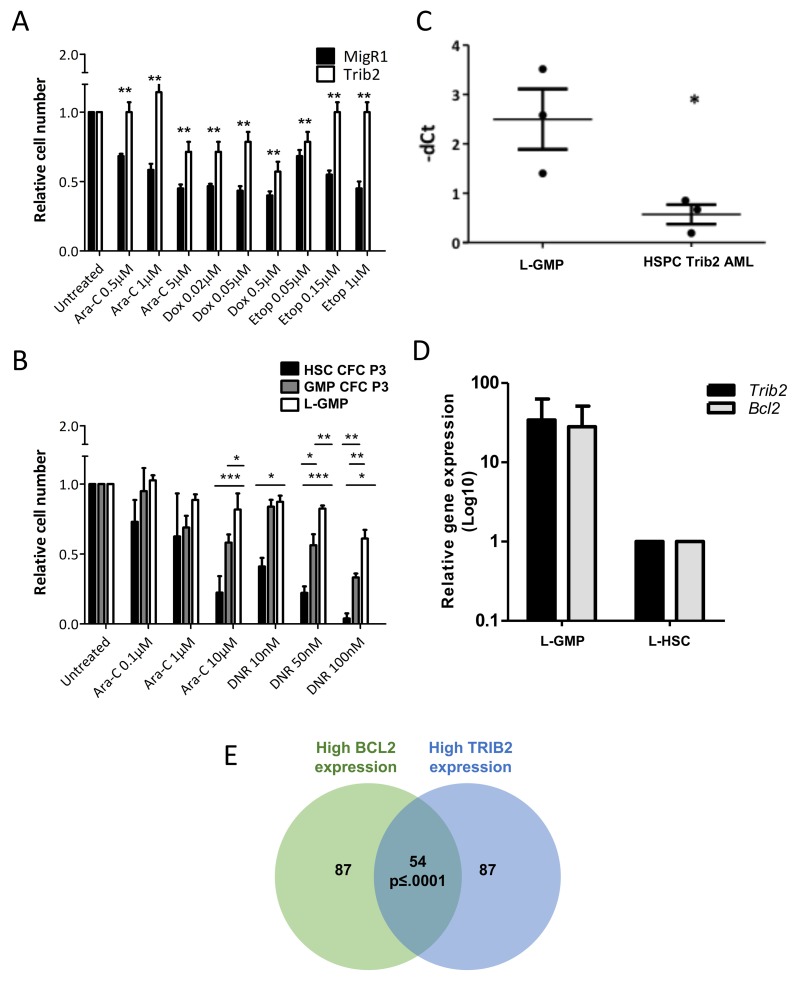
Figure 5. Trib2 L-GMP is highly drug resistant with correlation of high TRIB2 and BCL2 expression.
Cell viability of AML cells derived from Trib2 transduced HSPCs (A) and Trib2 transduced HSC and GMP CFC3 cells, and AML cells (L-GMPs) derived from Trib2 transduced GMPs (B), following treatment with the indicated concentrations of Ara-C and DNR and assessed for live cells at 24hours by trypan blue exclusion. (C) Transcript expression of Bcl2 in Trib2 L-GMPs and HSPC Trib2 AML cells determined by real time PCR. HPRT1 housekeeping gene was used to normalise the gene expression. Each data point represents an individual mouse in the respective arm. P<0.05 determined by student t test. Error bars represent +/− SEM. (D) Gene expression analysis of Trib2 and Bcl2 in Trib2 L-GMP (n=4) and L-HSC (n=1) cells determined by real time PCR. HPRT1 housekeeping gene was used to normalise gene expression. Bars represent average of group and error bars represent +/− SEM. (E) Venn diagram showing a strong expression correlation between TRIB2 and BCL2 expression, generated by filtering AML samples from the MILE study. p≤ 0.0001, empirically assessed after 10,000 Monte Carlo simulations.

