Figure 1.
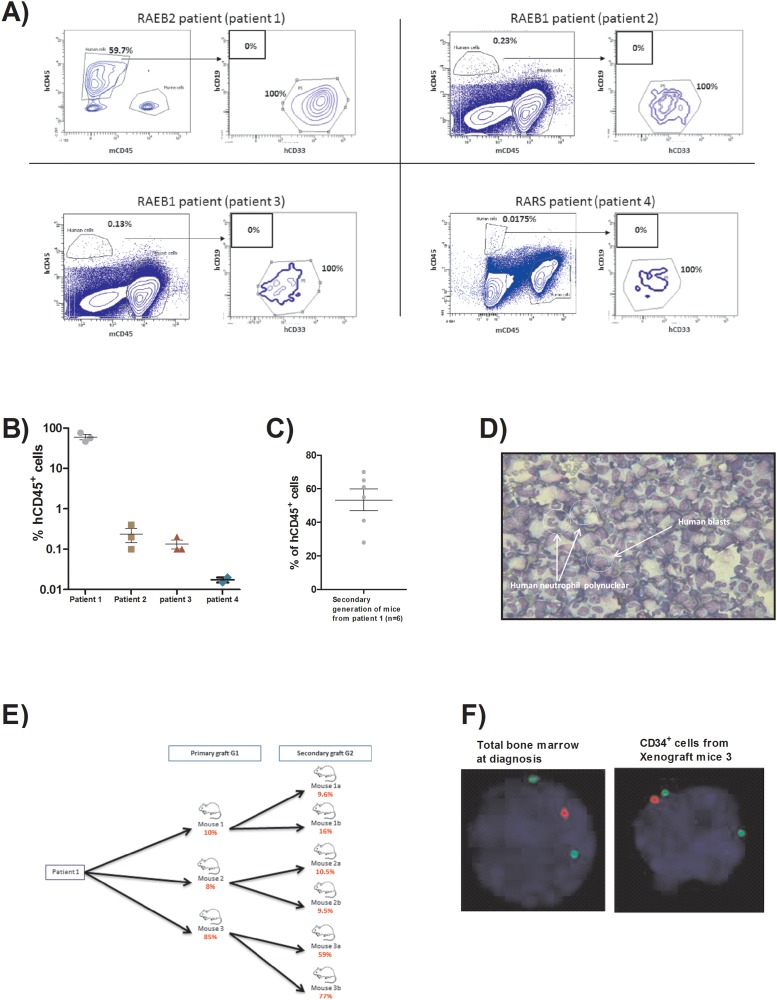
(A) FACS plots showing the percentage of human cells at sacrifice (6 months after transplant) for the four patients engrafted. (B) Scatter plot representing the percentage of human CD45+cells assessed by flow cytometry within the bone marrow retrieved from 1st generation mice for each patient (6 months after transplant). (C) Scatter plot representing the percentage of human CD45+ cells assessed by flow cytometry within the bone marrow retrieved from 2nd generation mice deriving from patient 1 (6 months after transplant). (D) Picture of bone marrow cytospin stained by MGG (x40) from 1st generation mouse of patient 1 showing the human blast infiltration and low granularity of granulocytic lineage. (E) Flow chart representing the number of human blasts counted on bone marrow cytospin from each mouse of 1st and 2nd generations derived from patient 1 (6 months after transplant). (F) FISH detection of del 5q. Nucleus is stained in blue (DAPI), del5q probe in red and control probe in green (x63). Experiment done on total bone marrow from patient 1 at diagnosis and on CD34+ sorted cells from one mouse of 1st generation (6 months after transplant).

