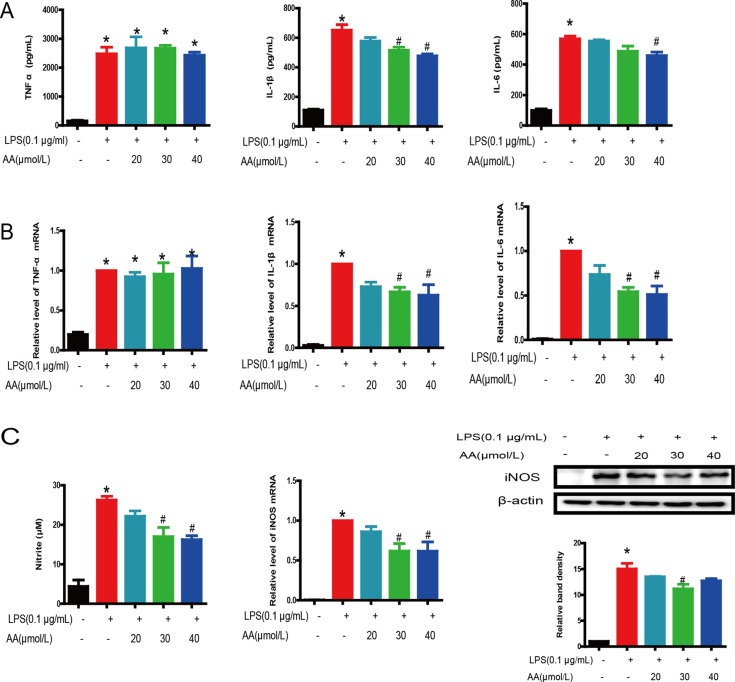
Figure 4. Inhibition of LPS-induced proinflammatory mediator production by AA in RAW264.7 cells.
(A) Levels of TNF-α, IL-1β and IL-6 in the cell culture medium were determined at 48 h after LPS and AA stimulation. (B) Gene expression levels of TNF-α, IL-1β and IL-6 mRNA were determined by real-time quantitative PCR after AA and LPS stimulation. β-Actin was used as a control. (C) The levels of NO in the cell culture medium and expression of iNOS in cells were determined 48 h after AA and LPS stimulation. Data are shown as mean ± SD (n = 5), and each experiments were duplicated for 3 times. *p < 0.05 versus control, #p < 0.05 versus LPS group.

