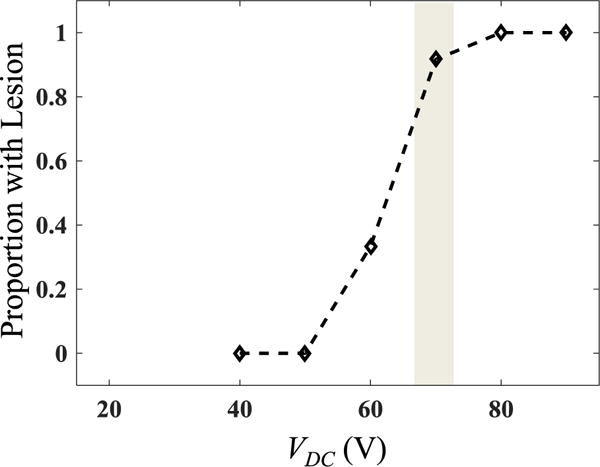
Fig. 12.

Experimental data for proportion of exposures at different driving voltages VDC that resulted in a lesion (n = 9–18 for each voltage level). The grey area corresponds to the range of voltages at which estimated boiling time is 10 ms at 18 mm depth in tissue, depending on tissue properties.
