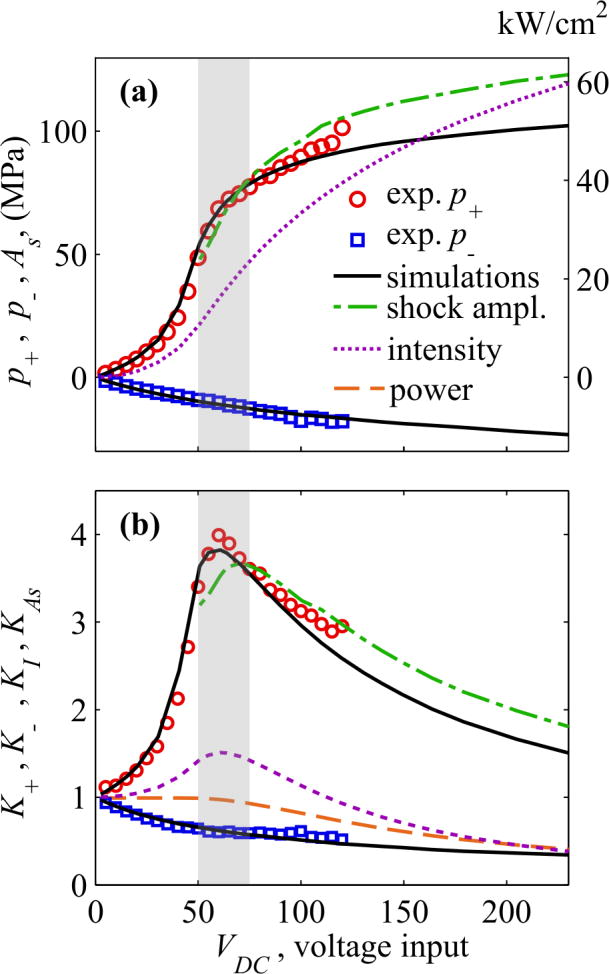
Fig. 8.
(a) Peak pressures in acoustic waveform at the focus, measured (circles) and simulated (solid curves) at increasing transducer voltage. (b) - Change in the focusing gain for the peak pressures, measured (circles) and simulated (solid black line), normalized to the linear focusing gain. Corresponding simulation data are also shown for the shock amplitude (dashed green line), focal intensity (dashed purple line), and total beam power (thick dashed red line). The grey rectangular area indicates the source outputs at which a shock front forms (50 V) and at which developed shock is achieved (75 V). While focal measurements were limited to voltages below 125 V, simulations were possible to higher outputs within operational capabilities of the system.

