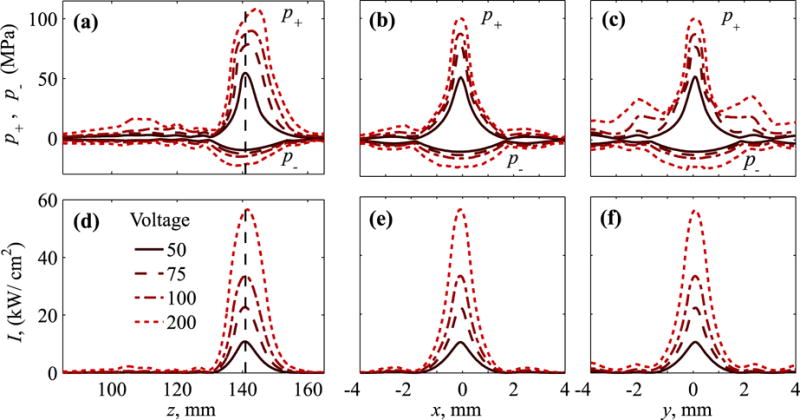
Fig. 9.

Distributions of the (a–c) peak positive, p+, and peak negative, p−, pressures and (d–f) intensity over beam axis (left frames) and in two perpendicular axes in the focal plane, x (center) and y (right) at increasing VDC = 50 − 200 V. Dashed vertical lines correspond to the location of the focus, z = 140.9 mm defined as a maximum of the peak positive pressure at 50 V.
