
Figure 2.
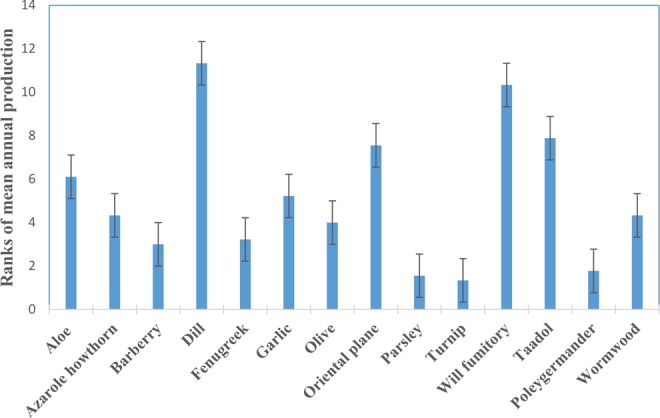
Ranking (1-14) of annual production level of aromatic waters in different manufactories over the past 3 years. Data are presented as mean ± standard deviation.
Official websites use .gov
A
.gov website belongs to an official
government organization in the United States.
Secure .gov websites use HTTPS
A lock (
) or https:// means you've safely
connected to the .gov website. Share sensitive
information only on official, secure websites.
Ranking (1-14) of annual production level of aromatic waters in different manufactories over the past 3 years. Data are presented as mean ± standard deviation.