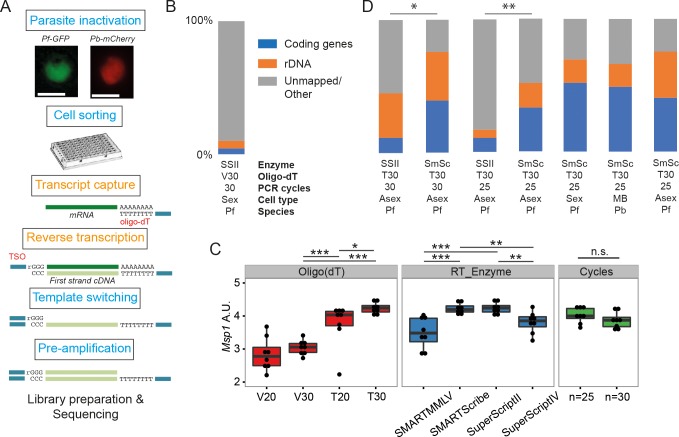
Figure 1. Establishment of a robust protocol for single-cell transcriptomic analysis of Plasmodium parasites.
(A) Overview of the single-cell RNAseq protocol. Steps in the original Smart-seq2 protocol (Picelli et al., 2013) that resulted in significant gains are highlighted in orange. (B) Relative numbers of reads mapping to coding RNA and rDNA for our initial sequencing trial, averaged over all cells in that trial (n = 5). (C) The protocol was evaluated using qPCR of the msp-1 transcript (PF3D7_09303000) on sorted pools of 10 asexual parasites (n = 8) (significance from Mann-Whitney test, p≤0.05 *p≤0.01 **p≤0.001 ***). The following reagents were tested: Oligo(dT)s containing a terminal anchoring base (A,G,C; V) or not (T) and of varying lengths (20 Ts vs. 30 Ts); four reverse transcriptase enzymes; 25 or 30 cycles of preamplification. (D) Relative numbers of reads mapping to coding RNA and rDNA for optimisation trials (6, 5, 6, 6 cells, respectively) and the main P. falciparum gametocyte (n = 237), P. berghei mixed blood (n = 182) and P. falciparum asexual (n = 189) datasets (final three bars). Asterisks indicate selected significant differences between proportions of reads mapping to coding genes, calculated using Mann-Whitney U (p≤0.05 *p≤0.01 **).

