Figure 2. Assessment of single-cell transcriptome sequence purity, diversity and accuracy.
(A) Individually sorted P. falciparum and P. berghei cells from a mixed pool revealed no doublets and little contamination. (B) Distributions of numbers of genes identified as expressed in our three main datasets. (C) Expressed genes (those with at least 10 reads in at least five cells) were representative of average gene length, suggesting that although the reverse transcriptase might not copy the whole of long transcripts, fragments of long genes are still detected. (D) Sequencing library preparation often introduces end bias, where either the 5’ or 3’ end of transcripts tend to be better covered. Our protocol introduced a small 5’-bias, which could be attributable to the reverse transcription sometimes initiating within transcripts in internal polyA regions, rather than in the 3’ poly-A tail.

Figure 2—figure supplement 1. Dual sorting of P. berghei and P. falciparum cells shows that contamination from ambient RNA is low.

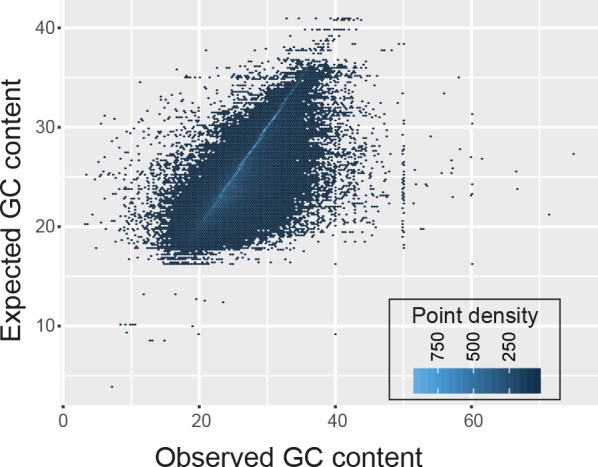
Figure 2—figure supplement 2. The GC content of transcript fragments agreed well with the GC content of genes.