. 2018 Mar 16;7:e31275. doi: 10.7554/eLife.31275

Figure 6. SPIN1 knockdown retards tumor growth more dramatically by inducing p53 activity.

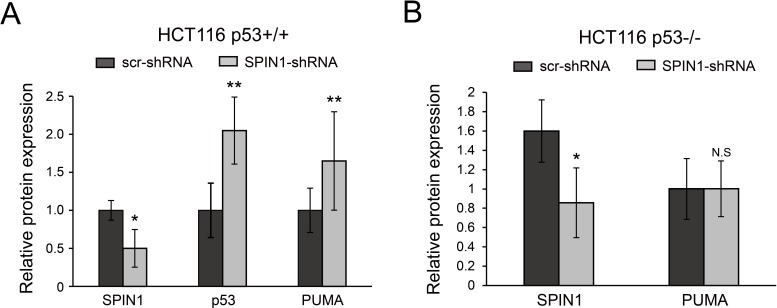
(A) and (B) Growth curves of xenograft tumors derived from HCT116p53+/+ cells and HCT116p53-/- cells that expressed scramble or SPIN1 shRNA. Data are represented as mean ± SEM, n = 6. (C) The images of xenograft tumors that were harvested at the end of experiment. (D) Quantification of the average weights of collected tumors from the above experiments. (E) and (F) The mRNA levels of SPIN1, p53 and p53 target genes were detected in six tumors by RT-qPCR (mean ± SEM, n = 6). (G) The protein levels of SPIN1, p53 and p53 targets were detected in six tumors samples by WB analysis with indicated antibodies. *p<0.05, **p<0.01 by two-tailed t-test (D, E, F, G).

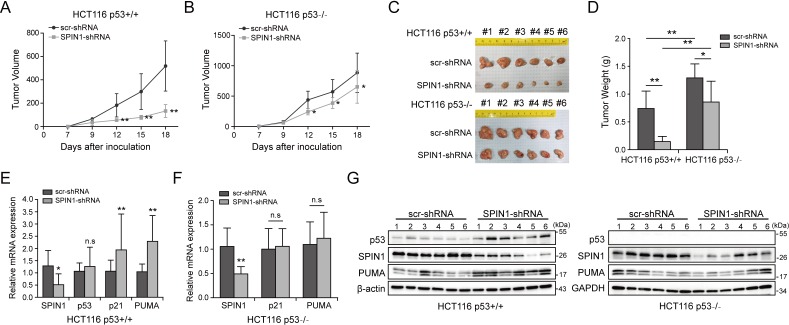
Figure 6.

Figure 6—figure supplement 1. Quantification of protein expression analyzed from xenograft tumors by Image J software.

Figure 6—figure supplement 1.

All data were presented as mean ± SEM, n = 6, *p<0.05, **p<0.01 by two-tailed t-test.
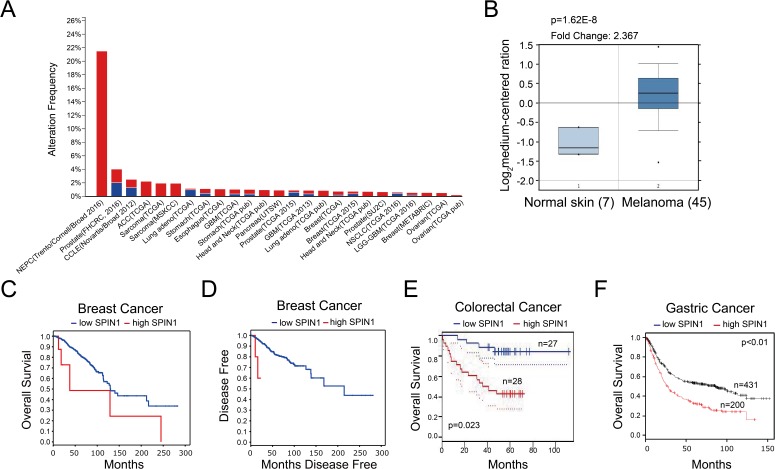
Figure 6—figure supplement 2. High expression of SPIN1 is detected in multiple cancers and associated with poor prognosis in cancer patients.

Figure 6—figure supplement 2.

(A) TCGA database was utilized, and the data were modified from the cBioPortal for Cancer Genomics (http://www.cbioportal.org/). (B) The expression profile of SPIN1 in cancers and normal tissues was searched in Oncomine Gene Browser (http://www.oncomine.org/). The results were from Talantov Melanoma database. Seven cases of normal skin and 45 cases of melanoma were analyzed in this figure. Correlation between SPIN1 upregulation and tumor stage, poorer prognosis or treatment resistance is not clear. (C and D) Overexpression of SPIN1 is correlated with overall survival and disease-free survival in breast cancer (http://www.cbioportal.org/), although the sample number of high SPIN1 patients is small and more samples are desired. (E) SPIN1 overexpression was associated with poor prognosis in colorectal cancer patients in an expression profile study from GSE17537 (http://www.PrognoScan.org/). (F) High expression of SPIN1 was correlated with poor overall survival in gastric cancer patients (http://www.kmplot.com).
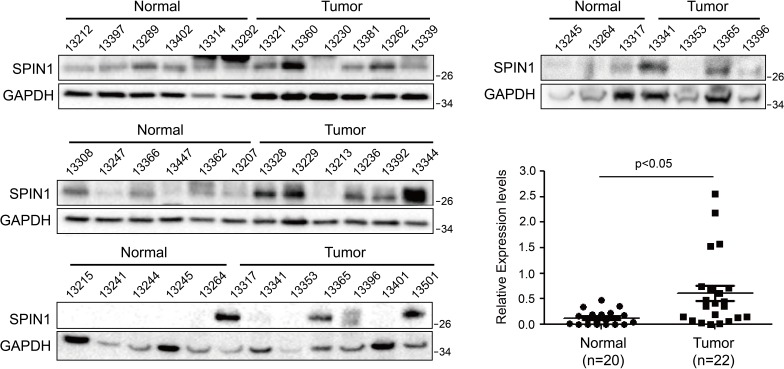
Figure 6—figure supplement 3. Western blotting analyses of human colon cancer tissues (n = 22) and normal colon tissue (n = 20) and quantification of SPIN1 expression (Mean ± SEM, p<0.05).

Figure 6—figure supplement 3.

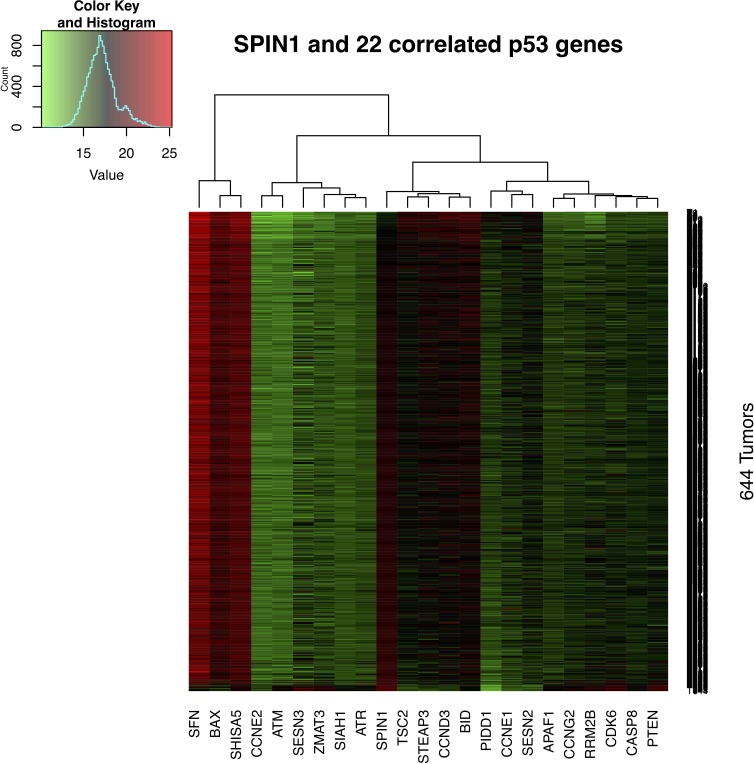
Figure 6—figure supplement 4. Expression of genes involved in p53 pathway is correlated with SPIN1 expression.

Figure 6—figure supplement 4.

mRNA expression levels of 664 colorectal tumors were retrieved from Genomic Data Commons (https://portal.gdc.cancer.gov/). In the data set, gene expression levels were measured with FPKM (Fragments Per Kilobase of transcript per Million mapped reads) and normalized using the Upper Quantile method. All 644 tumor samples were sorted based on the expression level of SPIN1 from low to high.