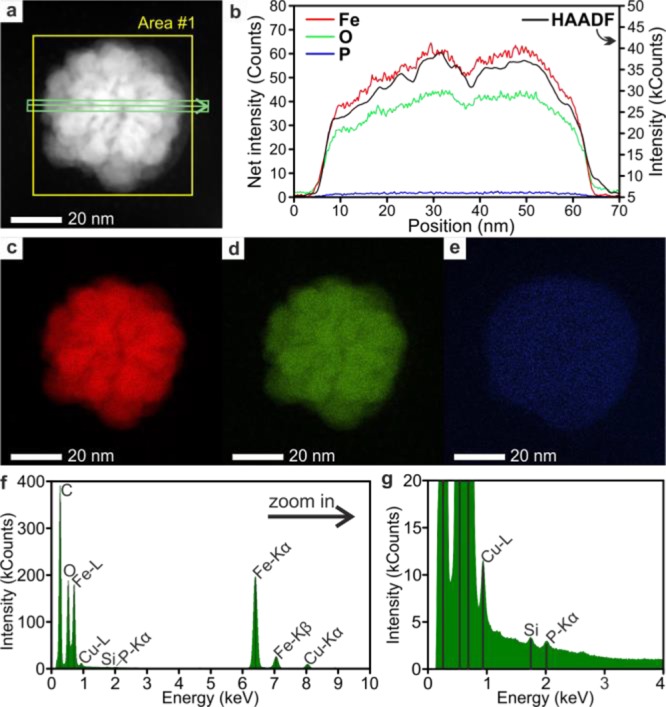
Figure 3.

Elemental mapping using EDX measurements of FexO nanoparticle in the HAADF-STEM mode. (a) STEM image of a FexO nanoparticle. The yellow frame shows the area #1, from where the integrated STEM EDX spectra (see f and g) were extracted. The green line (integrated) shows the taken line profiles of the background corrected peak intensities. (b) Line profiles representing intensity distribution of Fe (red), O (green), P (blue), and HAADF (black). The elemental maps of the FexO particle for (c) Fe, (d) O, and (e) P. (f) Integrated STEM EDX spectrum taken from the yellow area #1 indicated in a. (g) Zoom into the STEM EDX spectrum showing a minor peak of P, which is 200 times smaller than the Fe–Kα peak. Cu arises from the sample holder (Cu grids) and the small Si peak from the detector.
