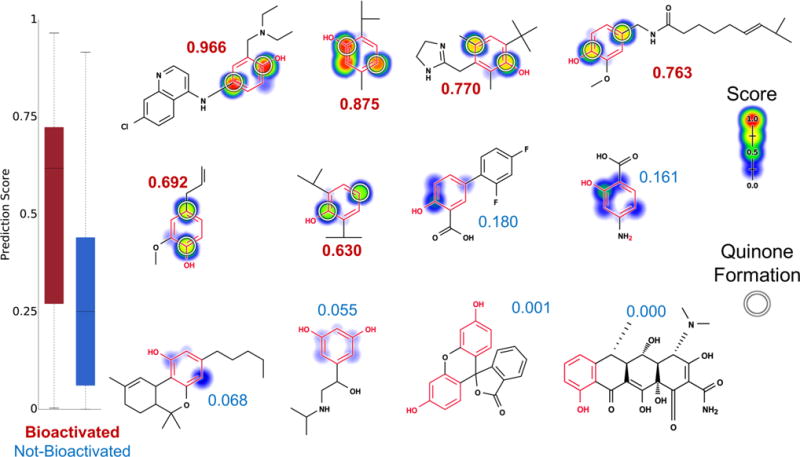
Figure 7.

Metabolism model identifies which phenols (highlighted in red) are bioactivated into quinones. Twelve examples from the phenol evaluation set, from left to right, top to bottom: amodiaquine,98–100 thymol,101 oxymetazoline,102 capsaicin,103 eugenol,104 propofol,105 diflunisal, aminosalicylic acid, dronabinol, orciprenaline, fluorescein, and doxycycline. The remaining molecules and their prediction are reported in the Supporting Information (Table S2). Attached numbers are the molecule quinone formation score, with red for the bioactivated phenols and blue for the rest. Experimentally observed sites of quinone formation are indicated by white circles. For each molecule, the colored shading represents quinone site scores, which range from 0 to 0.97. The model’s AUC accuracy on the phenol evaluation set is 73% and is better than the structural alert alone (two-sided p-value = 0.0026).
