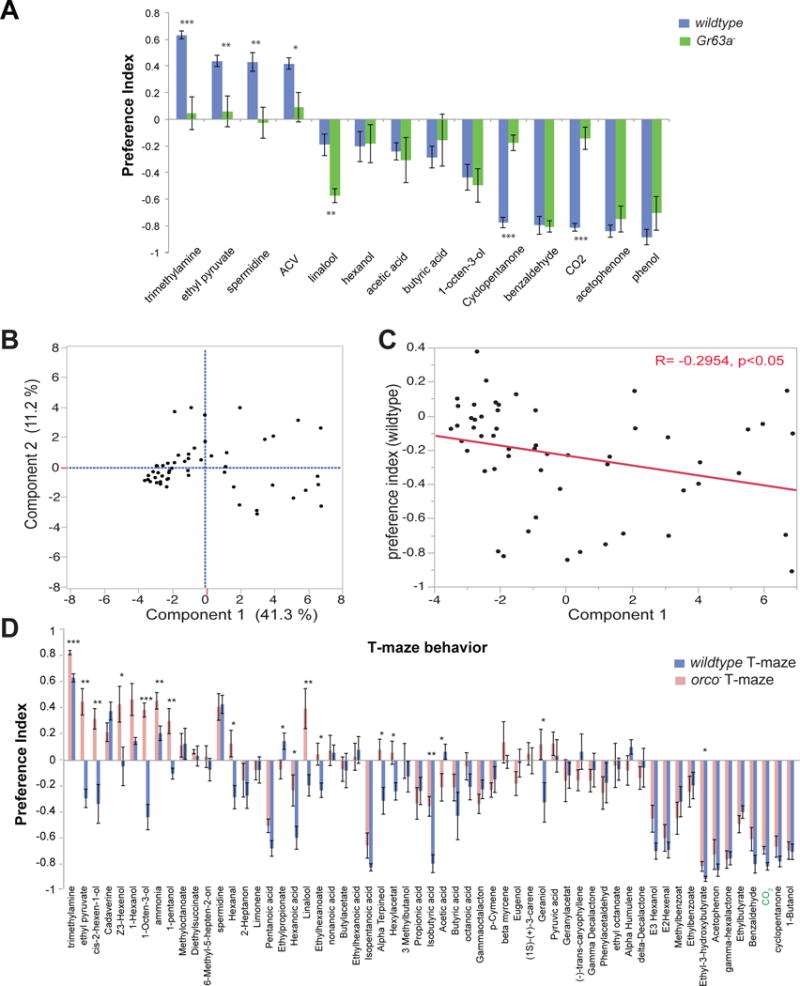
Figure 5. T-maze behavior and receptor dependency in Drosophila.

(A) Bar graph of olfactory behavior for the indicated odorants (1% concentration) and genotypes in a T-maze: n = 6–16 trials per odorant per genotype. (B) Shown are the first two principle components on a 24 dimensional Odorant receptor response space for 54 odorants from Halem and Carlson, 2006. Numbers in parenthesis indicate the fraction of variance in the data represented in each axis. (C) Scatter plot of mean preference index from T-maze assays of each of the 54 odorants (10−2 dilution) vs. Principle component 1 values for each odorant. R = Pearson correlation coefficient. (D) Mean preference index in a T-maze behavior assay for the indicated odorants (10−2 dilution) in wildtype and orco− D. melanogaster Error bars are s.e.m. t-test; p*<0.05, **<0.005, ***<0.001.
