
Fig. 4. Cytocompatibility testing of PDMS substrates.
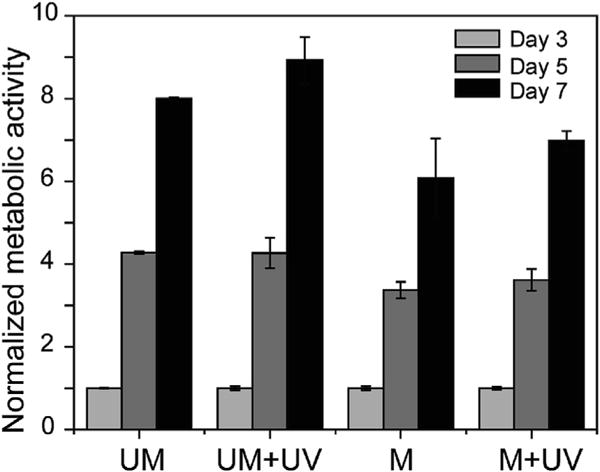
Metabolic activity of 3T3 fibroblasts on PDMS substrates, with normalization to UM at day 3. UV exposure was applied to form UM + UV and M + UV samples after cell seeding for 24 h (day 1), and the AlamarBlue assay was performed on day 3, 5 and 7. UM = unmodified PDMS, UM + UV = unmodified PDMS with UV exposure, M = modified PDMS, M + UV = modified PDMS with UV exposure. (n = 3 per group. Data presented as mean ± s.d.). The values of metabolic activity at all time points on each PDMS substrate were statistically significant from each other (p < 0.001 for all comparisons).