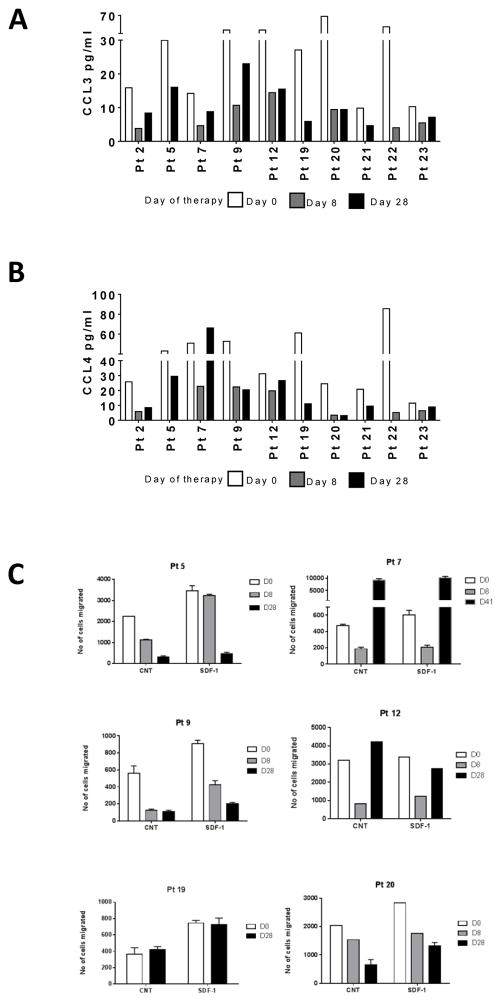
Figure 2. Changes in chemokine levels and inhibition of chemotaxis during acalabrutinib therapy.
(A) Levels of CCL3 in plasma at baseline (day 0) and 8 and 28 days of therapy. (B) Levels of CCL4 in plasma at baseline and 8 and 28 days of therapy. Levels of chemokines were measured using ELISA assay as described in the Methods. (C) Changes in chemotaxis after acalabrutinib therapy. Lymphocytes were isolated from 6 patients before (day 0) and after days 8 and 28 of acalabrutinib therapy. Cells were incubated without (control [CNT]) or with chemokine (SDF-1) for 3 hours, and migration of cells was accessed as described in the Methods.

