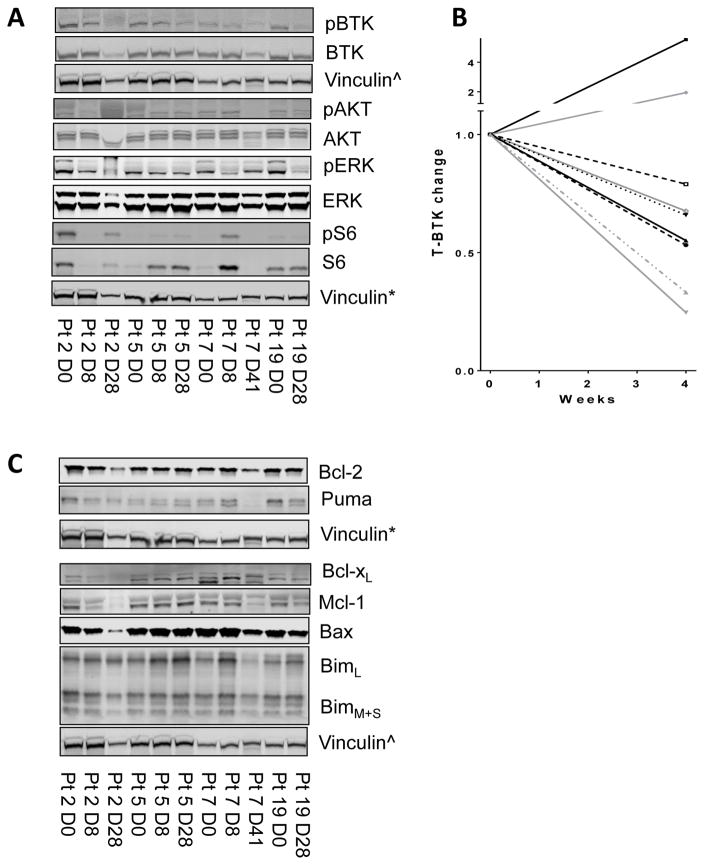
Figure 4. Changes in BCR pathway protein levels and signaling in CLL cells before and after acalabrutinib therapy.
CLL lymphocytes were isolated at start (day 0) [D0] and after 8, 28, or 41 days (D8, D28, or D41), and protein extracts were prepared for immunoblots. (A) BCR signaling proteins in CLL cells before (D0) and post-acalabrutinib (D8, 28, or 41). (B) Quantitation of total BTK protein from patient samples (n = 9), normalized to vinculin. (C) Effect of acalabrutinib therapy on Bcl-2 family proteins. CLL cells were obtained before (D0) and post-therapy (D8, 28, or 41), and cell lysates were prepared for immunoblot assays in which expression levels of Bcl-2 family anti-apoptotic proteins Bcl-2, Mcl-1, Bcl-xL, Bax and Bim proteins were measured. The immunoblots presented in figure 4 (A and C) were obtained by running two gels. First one had total and phospho BTK and Bcl-xL, Mcl-1, Bax, Bim, and vinculin^. Second gel provided Bcl-2, Puma, total and phospho AKT, ERK, and S6, and vinculin*.

