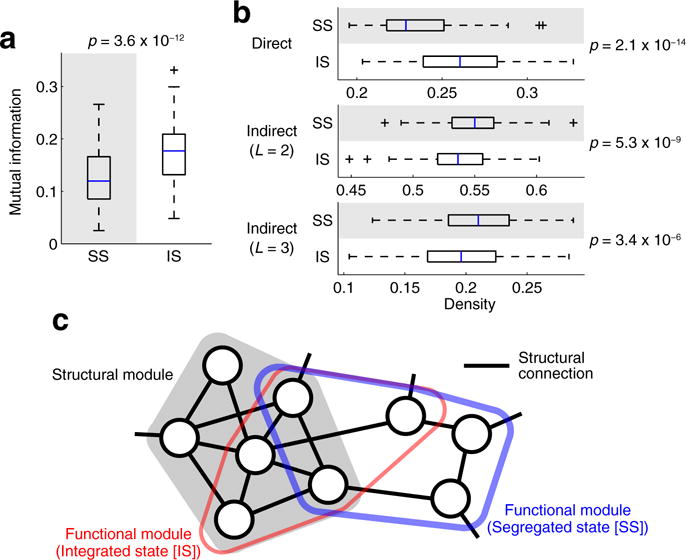
Fig. 5.

a Similarity of network partitions between structural connectivity and the centroid of the segregated (left) or the integrated (right) state. b Density of structural connections within functional modules. The density is shown for direct structural connections (top) and for indirect structural connections with the shortest path lengths L = 2 (middle) and L = 3 (bottom). c A schematic view of the relationship among a single structural module and an overlapping functional module captured during segregated and integrated states. Nodes represent brain regions, and the thickness of the blue or red line indicting boundaries of the functional module represents the strength of within-module functional connectivity. In the segregated state, the functional module is more coherent than in the integrated state, while also deviating more strongly from the underlying structural module
