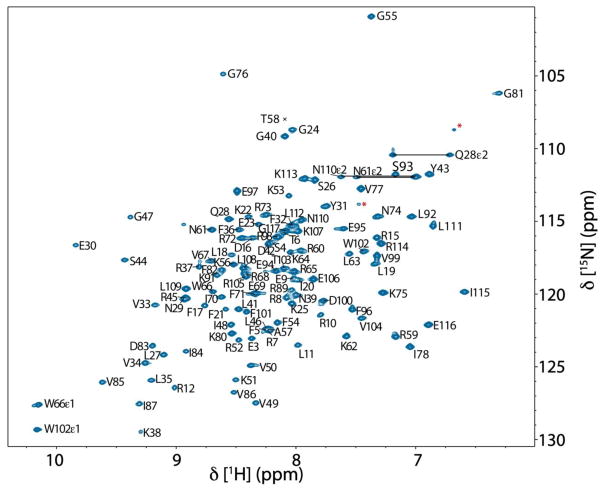
Fig. 1.
900 MHz (1H, 15N) HSQC spectrum of 400 μM T. maritima RNase P protein in 20 mM sodium phosphate (pH 6.0), 80 mM NaCl, 50 μM DSS, 8 mM sodium sulfate, and 5 % D2O at 318 K. Assigned residues are indicated using single letter codes. Side-chain NH2 resonances of asparagine and glutamine are connected by horizontal lines. Signals labeled by red asterisks likely derive from arginine εNH resonances while those non-labeled are likely from minor population of the structural conformations in the sample. The assigned resonances with only a black cross indicate the position of the residue below the spectrum’s intensity levels. Numbering of T. maritima RNase P protein corresponds to the gene sequence RNPA_THEMA (UniProtKB - Q9X1H4).

