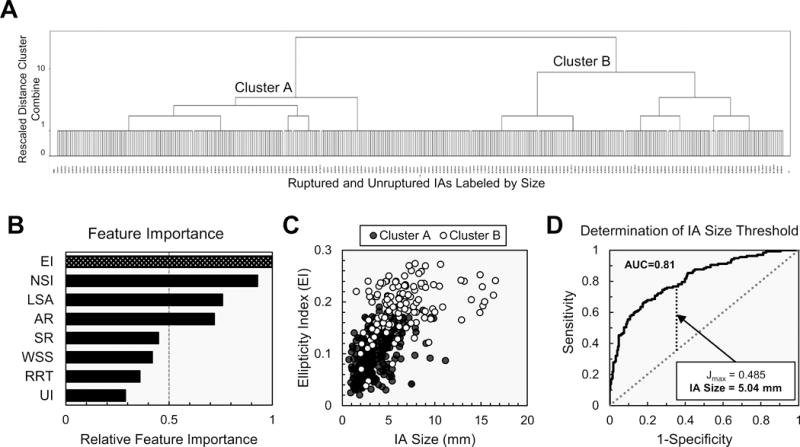
Figure 2.

Results of hierarchal cluster analysis. (A) The IAs, labeled by size, and separated into two clusters. (B) EI was the most important feature in separating the two clusters. (C) A scatter plot of EI versus IA size indicated that more hemispherical and smaller IAs tended to be assigned to Cluster A. (D) ROC analysis showed that IA size was a good indicator of cluster assignment (AUC=0.81) and the best size cutoff to separate small and large IAs was 5.04mm.
AR=aspect ratio; EI=ellipticity index; LSA=low wall shear stress area; NSI=nonsphericity index; RRT=relative residence time; SR=size ratio; UI=undulation index; WSS=wall shear stress
