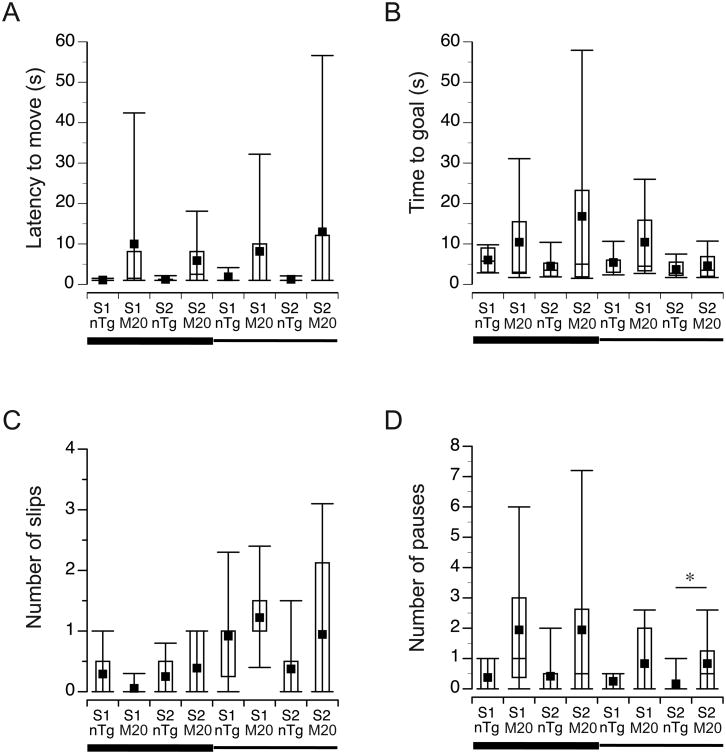
Figure 3. Locomotor evaluation in beam-traversing test.
M20 and nTg mice (n = 10 and n = 12, respectively) were tested on wide and narrow beams in two consecutive days (sessions); each session consisting of two trials. Data from the two trials were averaged and are presented as box plots, including; first quartile, median (horizontal line in the central box), mean (black square), third quartile (the central box represents an interquartile range). The whiskers on the bottom and the top represent the 10th and the 90th percentile of the scores. S denotes session. The horizontal wide and narrow lines below x-axis represent the 2.5-cm and 1.7cm wide beams, respectively. * p < 0.05.

