Figure 4.
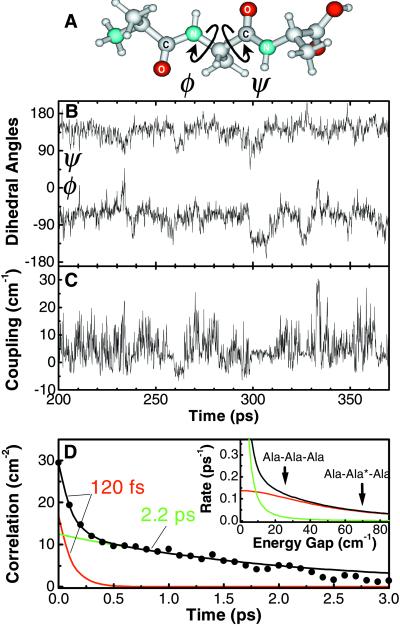
(A) Molecular structure of trialanine. The central dihedral angles (φ,ψ) are indicated by arrows. (B) Trajectory of the dihedral angles φ(t) and ψ(t) of the central amino acid of trialanine as obtained from the MD simulation. (C) Instantaneous coupling β(t) computed from the trajectory. (D) Coupling correlation function 〈δβ(t)δβ(0)〉, the Fourier transform of which determines the cross relaxation rate (Inset). The arrows mark the frequency splittings of Ala-Ala-Ala and Ala-Ala*-Ala, respectively. The red and green curves represent the fast and slow components of the correlation function, respectively.

