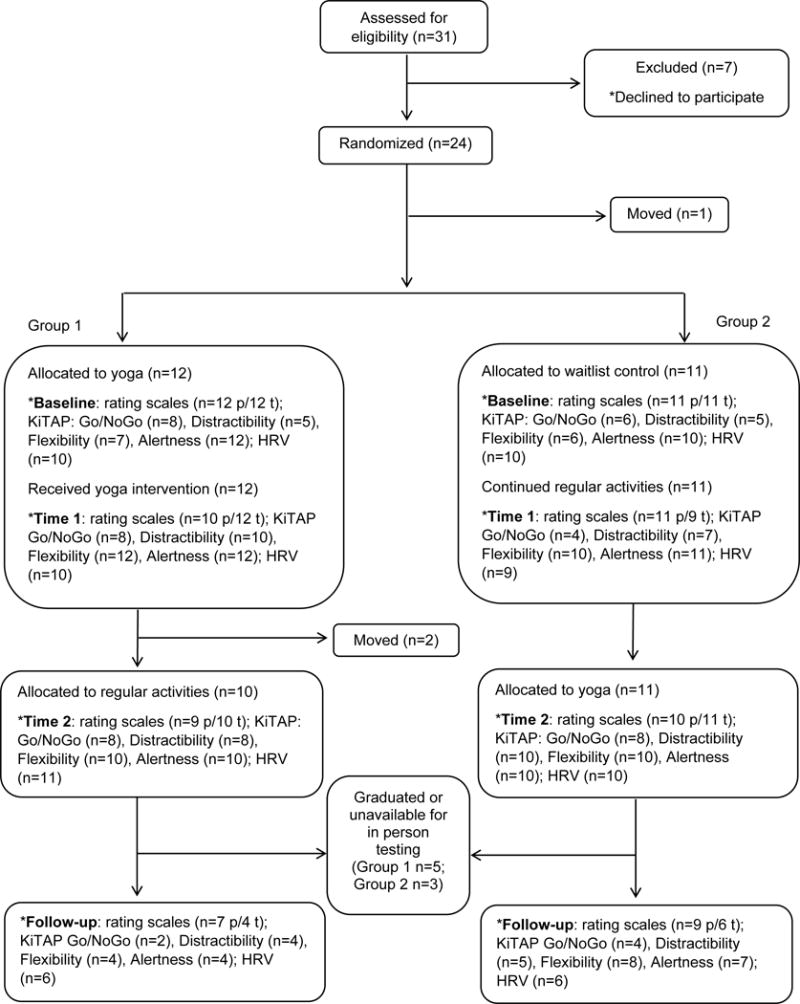
Figure 1.

Participant flowchart of the study depicting both the number of children included in each group over the course of the study as well as the sample sizes (n) available for analysis of each outcome measure: parent (p) and teacher (t) rating scales, KiTAP subtests, and heart rate variability (HRV).
