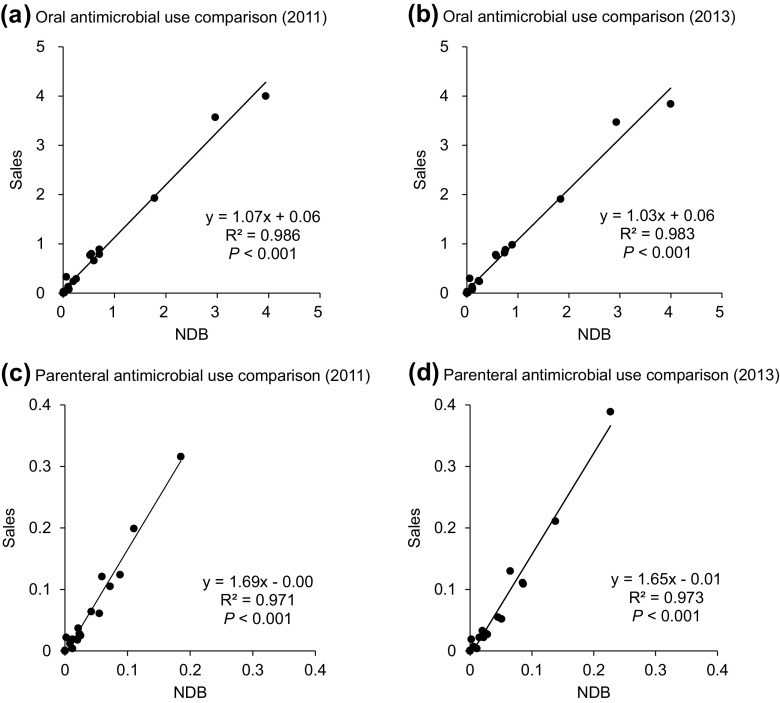
Fig. 1.
Oral and parenteral antimicrobial use comparison calculated by the NDB and the sales data in 2011 and 2013. Scatter plots represent DIDs at the ATC 4th level calculated by the NDB and sales data with linear regression. DID defined daily doses per 1000 inhabitants per day, ATC anatomical therapeutic chemical

