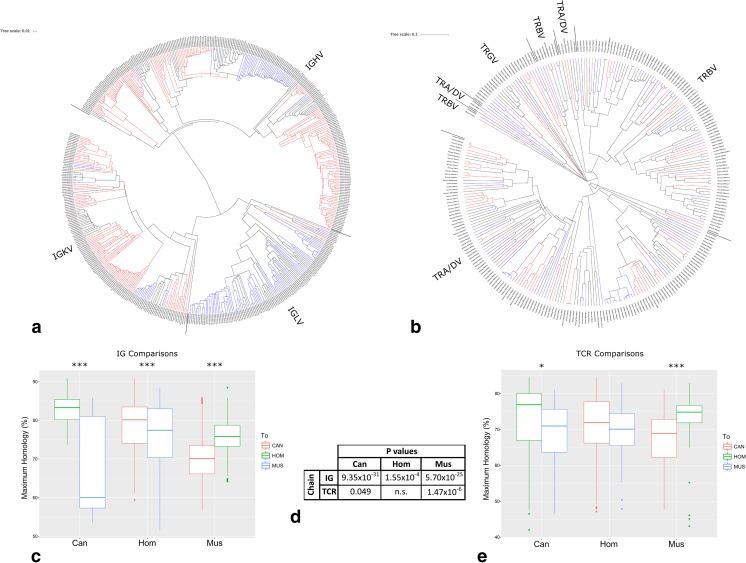
Fig. 8.
AR V gene comparisons between dog, human, and mouse. Phylogenetic tree of all of the functional a IG V and b TR V genes in human (black), dog (blue), and mouse (red). Plot of the maximum individual homology of each c IG V and e TR V gene from dog (red), human (green), and mouse (blue) to the nearest gene from each of the other two species. Student’s t test was carried out within each comparison, and the p values are shown (d)

