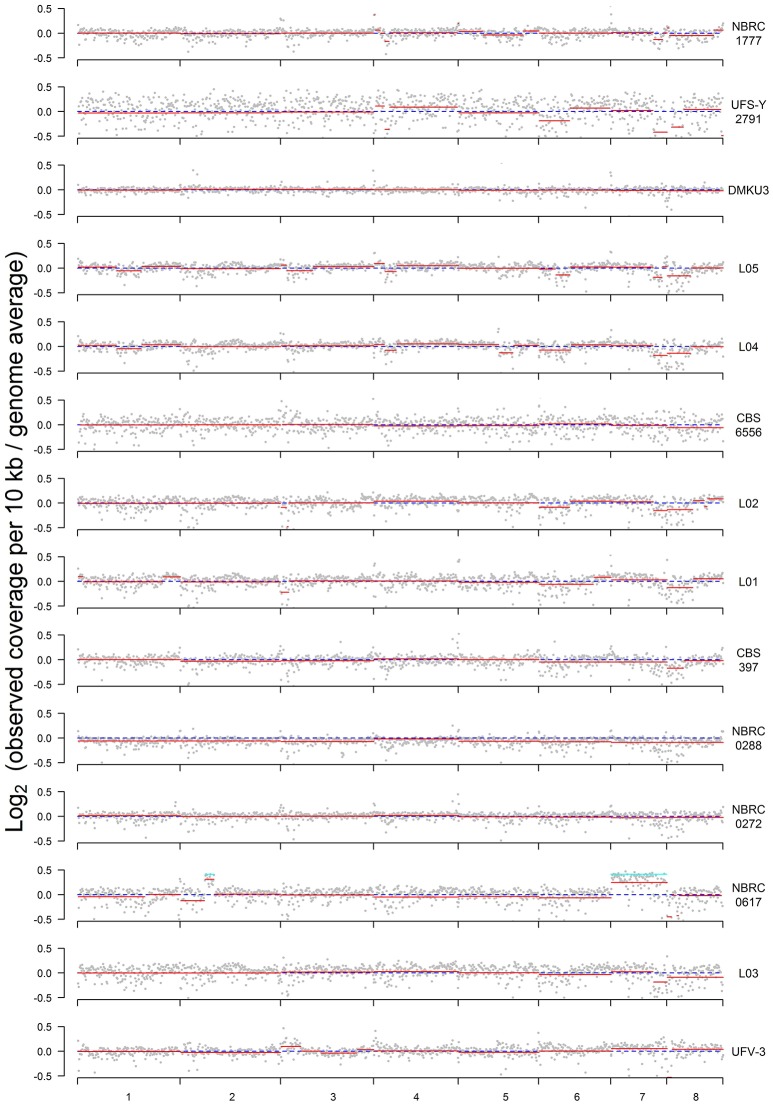
Figure 2.
Plots of sequence coverage in each strain. The Y-axis is log2 of the ratio between the observed and expected coverage, for 10-kb windows through the genome; a value of zero (dashed blue line) indicates no difference. Expected coverage is based on the average in the whole genome. Red lines show the segmental means for consecutive 10-kb windows calculated using the Bioconductor package DNAcopy. Cyan lines for NBRC0617 indicate the value expected for the 1.33-fold increase in coverage that would result from a fourth copy of a region in a triploid.

