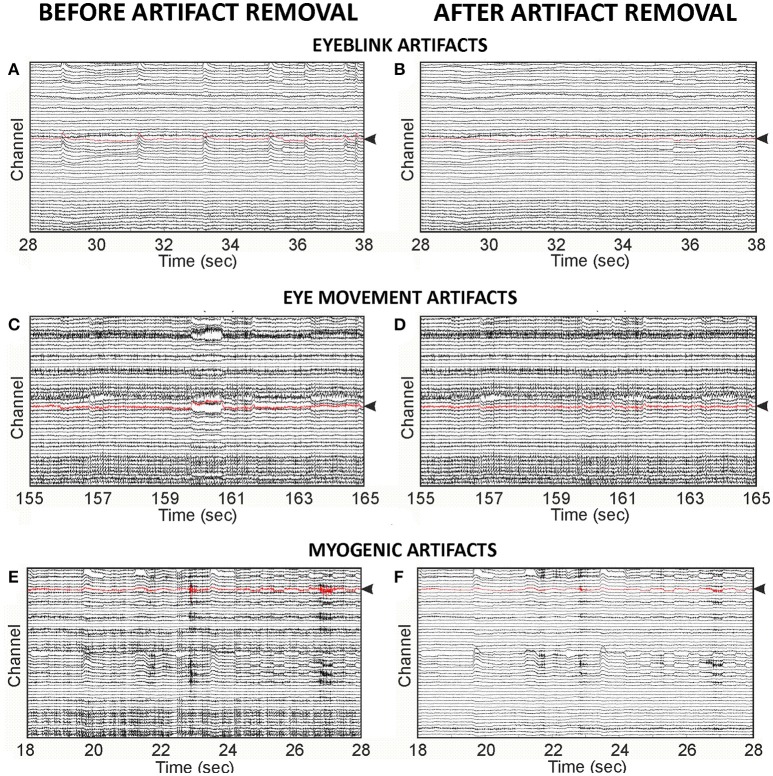
Figure 2.
Examples of original EEG cyclist data and EEG data reconstructed after SVM classified artifactual ICs were removed. (A) EEG trace with eyeblink artifacts: Original data segment containing seven eyeblink artifacts. Average SNR = 14.23 dB. (B) EEG trace after eyeblink artifact removal: The same data segment shown in (A) reconstructed after removal of the ICs automatically classified as artifactual for eyeblinks. Average SNR = 4.64 dB. (C) EEG trace with eye movement artifacts: Original data segment containing one eye movement artifact (at~160 s). SNR = 5.92 dB. (D) EEG trace after eye movement artifact removal: The same segment shown in (C) reconstructed after removal of the ICs automatically classified as artifactual for eye movements. SNR = 1.18 dB. (E) EEG trace with myogenic artifacts: Original data containing two myogenic artifacts (at ~23 s and 27 s). Average SNR = 15.45 dB. (F) EEG trace after myogenic artifact removal: The same segment shown in (E) reconstructed after removal of the ICs automatically classified as artifactual for myogenic artifacts. Average SNR = 6.28 dB. In each EEG data segment, distance between electrodes (between each point on the abscissa) = 100 microvolts. Average SNR was calculated in the EEG channel highlighted in red shown in each EEG trace.

