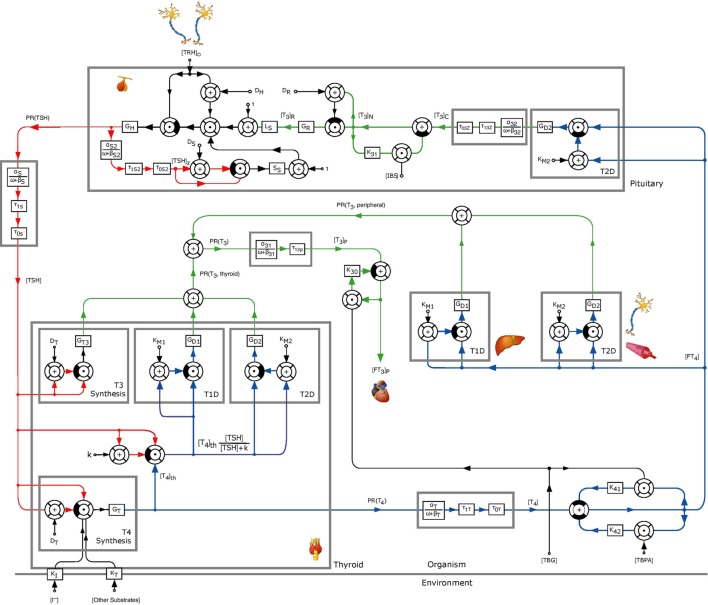
Figure 1.
Block diagram of the thyrotropic feedback control loop with an additional TSH-T3-shunt, adapted from Ref. (1, 2). Except for GT3, k, and GD1, all parameters were adopted from the model in Ref. (1, 2). The parameters GD1 and GT3 were estimated to obtain an optimal (in a least squares sense) fit to measured in vivo FT3-concentrations. To this end, the value of k was normalized to 1 mU/l.

