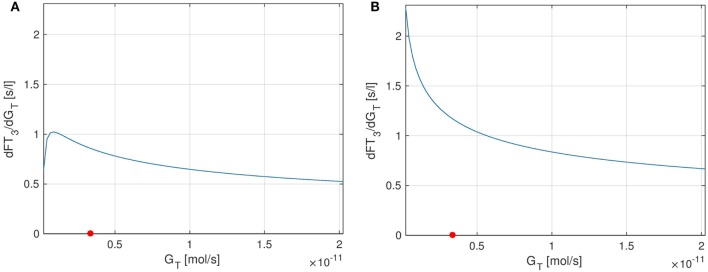
Figure 9.
Plots of the stationary sensitivity of FT3 w.r.t. the parameter GT as a function of the thyroid’s secretory capacity GT. Two configurations of the model are shown: one including the TSH-T3-shunt and one without the shunt. The red point in the Figures indicates the nominal GT-value from Ref. (1). (A) Full TSH-T3-shunt, (B) no shunt included.

