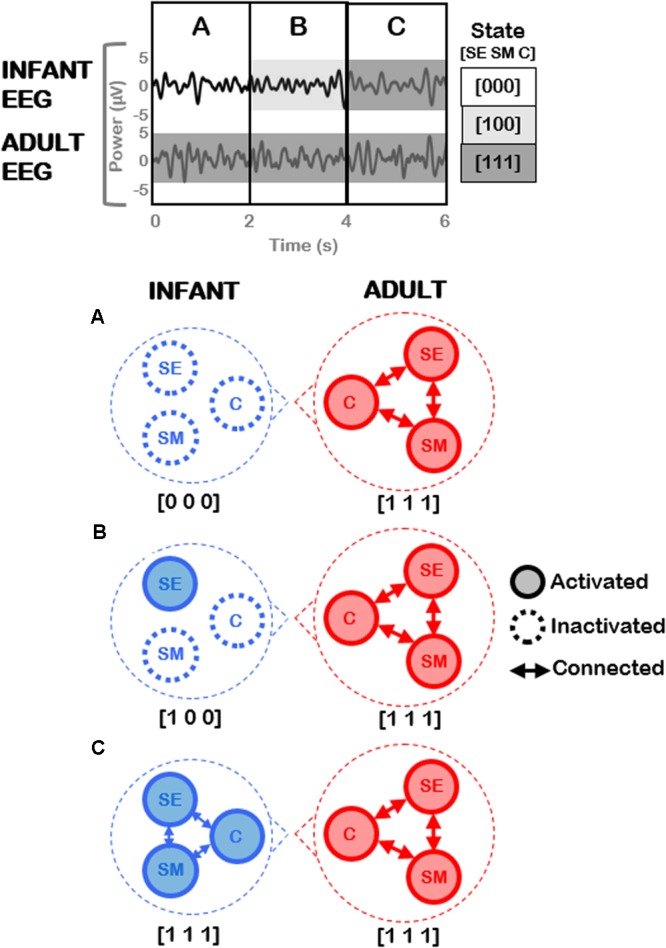
FIGURE 9.

Illustration of future planned EEG analysis utilizing current coding framework. (Top) Hypothetical example of EEG signals concurrently measured from an infant and an adult during joint play. Three different time periods (A, B, C) may be identified based on different social states in the infant, assuming that the adult remains in a constant play-congruent state [1 1 1]. (Bottom) Highly-simplified and illustrative predictions of the patterns of neural activation expected during each time period, for infant (Left) and adult (Right) respectively. Each node represents a neural circuit subserving each dimension (socioemotional [SE], sensorimotor [SM], and cognitive [C]). Arrows represent functional connectivity between these respective neural circuits.
