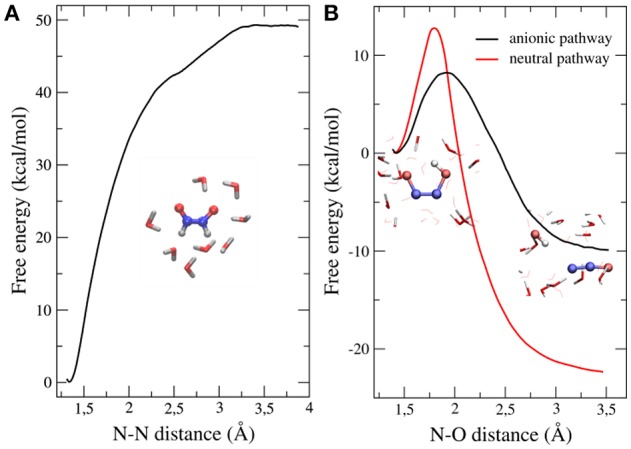
Figure 3.

Free energy profiles of both steps leading to N2O formation starting from HNO dimerization. (A) Dimerization profile. (B) N2O formation profile. Results for both anionic and neutral pathways are shown. Adapted from Bringas et al. (2016), with permission from Elsevier.
