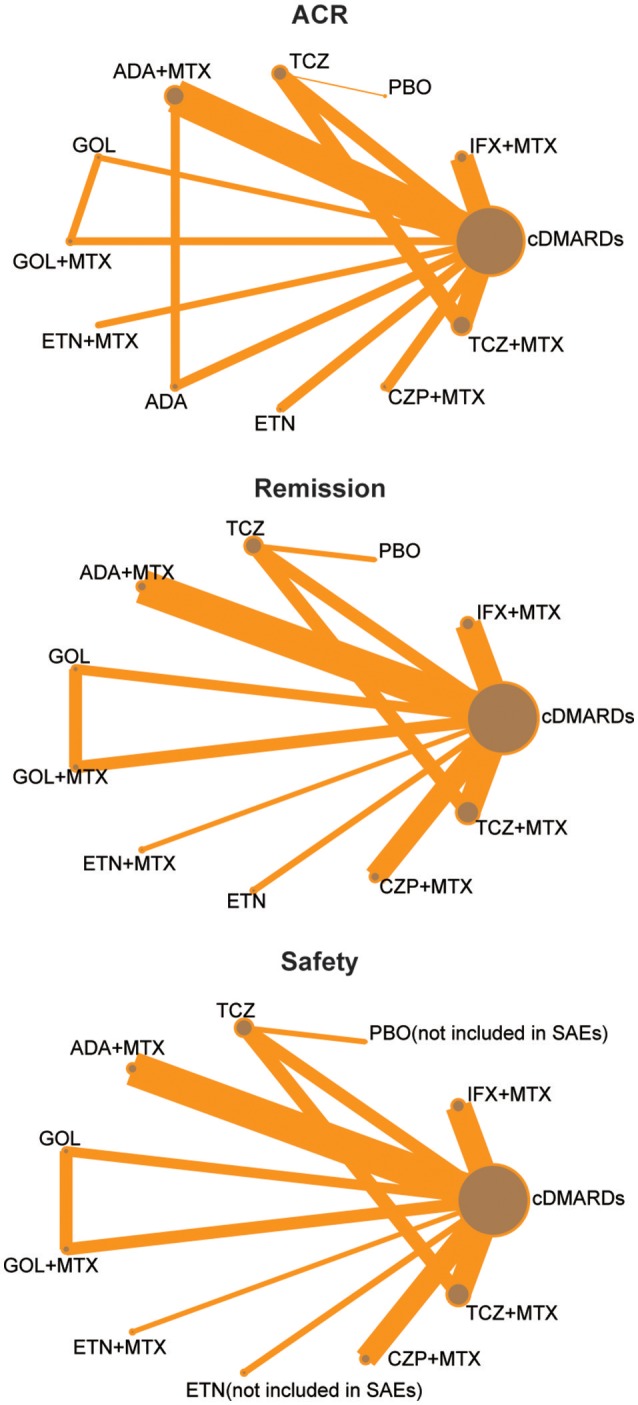
Figure 1.

Full network of comparisons of efficacy and safety outcomes (The width of the lines is proportional to the number of trials comparing each pair of treatments; the area of circles represents the cumulative number of patients for each intervention).
