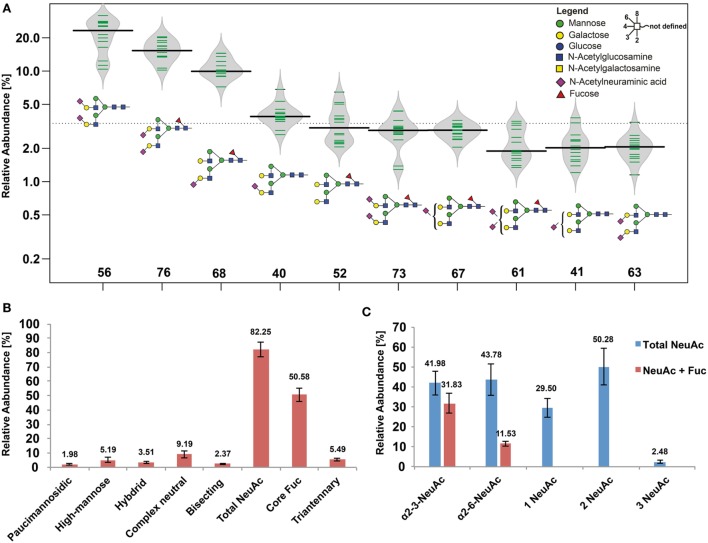
Figure 1.
Healthy human skin N-glycome. (A) Bean diagram representing the 10 most abundant N-glycans determined from 14 patients. Green bars indicate individual data points, the black line represents the median, and the gray area depicts the data density. Columns indicate the glycan structures given by their glycan ID (Table S1 in Supplementary Material). (B) Relative N-glycan class abundances found in healthy skin biopsies. Sialylated and fucosylated structures were the major components representing the human skin N-glycome. (C) Relative abundances of different structure features found on sialylated N-glycans. Blue bars represent sialylated N-glycans with and without core fucose depending on their sialic acid linkage, showing that core fucosylation was a more abundant feature on N-glycans carrying one or two α2-3 linked N-acetylneuraminic acid (NeuAc) residues (if both, α2-3 and α2-6 linkages were present on one N-glycan, this N-glycan was considered in both linkage categories). Overall, α2-6-linked NeuAc was a slightly more abundant feature compared with α2-3-linked NeuAc. Most of the sialylated N-glycans carried two NeuAc residues. Tri-antennary species were below 3% and rather low abundant using porous graphitized carbon, while multiplexed capillary gel electrophoresis with laser induced fluorescence detection (xCGE-LIF) detected slightly higher levels of tri- and tetra-antennary N-glycans (see Supplementary file “xCGE-LIF quant.xlsx” in Supplementary Material).

