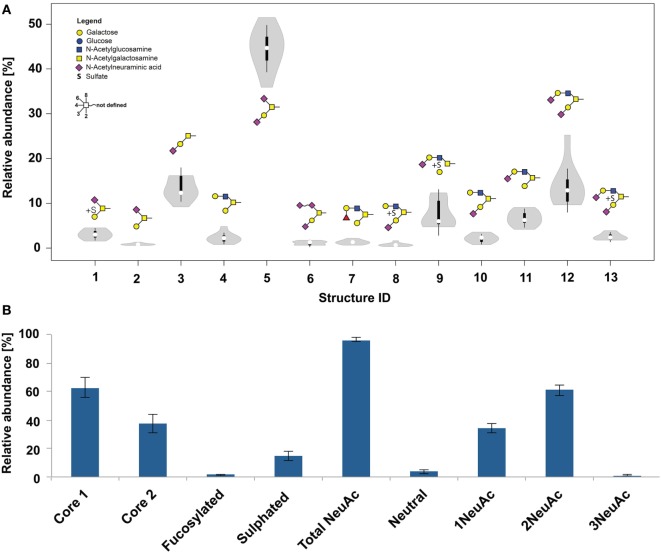
Figure 2.
(A) Violin diagram showing the distribution of O-glycan structures within nine patients (thickness indicates the majority of the data points). Columns indicate the glycan structures given by their glycan ID (Table S2 in Supplementary Material). (B) O-glycan composition of healthy frozen skin biopsies from nine patients.

