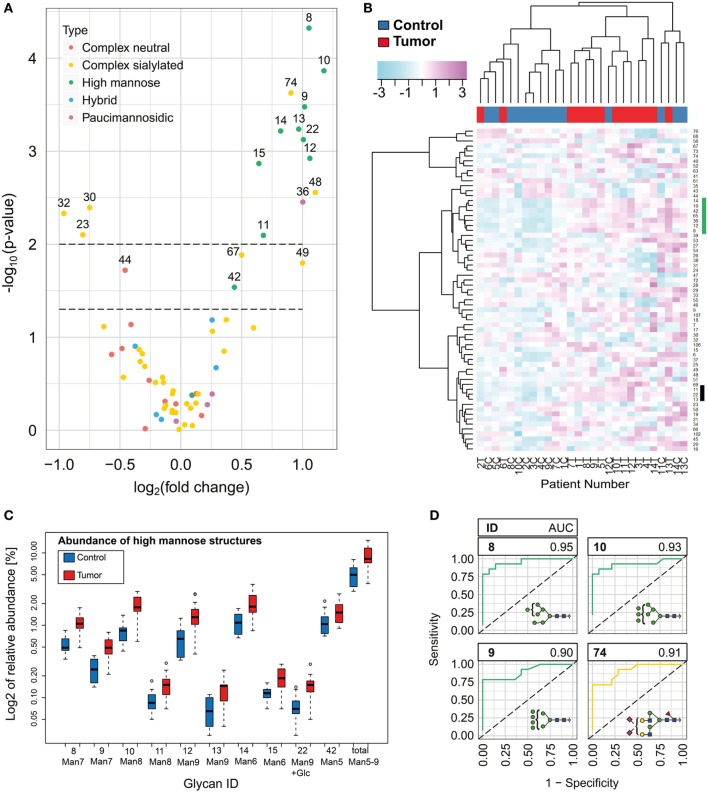
Figure 3.
N-glycan level changes in basal cell carcinoma. (A) Volcano plot for the quantified N-glycan species indicating significant changes of relative abundance levels for individual N-glycan species. Two p-value thresholds are indicated (p = 0.05 and p = 0.01). N-glycan abundance levels above the second threshold were considered as significantly changed. (B) Unsupervised hierarchical cluster analysis of healthy and tumor skin. Rows display each of the 14 patient N-glycan data (T, tumor tissue; C, healthy control). Columns indicate the glycan structures given by their glycan ID (Table S1 in Supplementary Material). Based on the N-glycan data, the algorithm classified the majority of the healthy and tumor skin samples into two major groups. Two glycan clusters (marked by green and black bar) were observed in particular exhibiting increased levels for oligomannose type N-glycans. (C) Box plot graph representing log2 abundances of oligomannose N-glycans and the total of oligomannose structures in normal and tumor tissue. (D) ROC of four N-glycan structures with the highest area under the curve values.

