Figure 1.

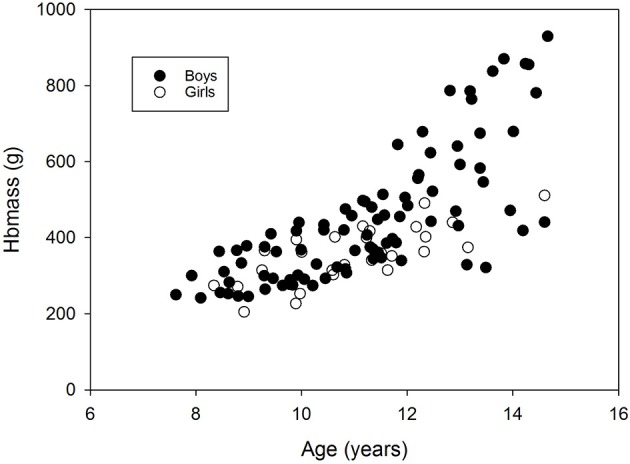
Changes in Hbmass with age. Data are from the longitudinal part of study 1 (trained children) and the cross-sectional sub-study (control group).

Changes in Hbmass with age. Data are from the longitudinal part of study 1 (trained children) and the cross-sectional sub-study (control group).