
Figure 1.
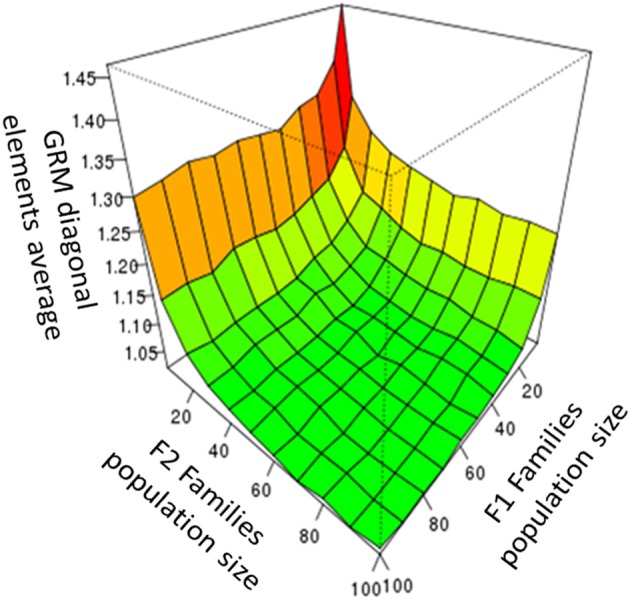
The average GRM diagonal elements observed for F2 families, as a function of the population size of the F1 and the F2 families.
Official websites use .gov
A
.gov website belongs to an official
government organization in the United States.
Secure .gov websites use HTTPS
A lock (
) or https:// means you've safely
connected to the .gov website. Share sensitive
information only on official, secure websites.
The average GRM diagonal elements observed for F2 families, as a function of the population size of the F1 and the F2 families.